

Configuring Data Recording
Data recording is the mechanism by which the Edge connects to field devices, reads configured process variables at a defined sampling interval, and stores the measured values in its internal time-series database. These stored values serve as the data source for Grafana dashboards and can optionally be forwarded to external platforms such as AWS IoT Core.
Before variables can be configured, the field device must already be added to the Edge and a connection must be established. The following information should be available:
- IP address of the field device
- Device type (Modbus TCP, OPC UA, or Siemens SIMATIC S7)
- Variable addresses or structure: for manual entry or CSV-based import, the addresses of the variables to be recorded (see Protocols and Field Devices for address formats); for S7 controllers with symbolic addressing, a live connection to the PLC is sufficient — the built-in import browser retrieves the variable structure directly from the device.
See Adding a Field Device for step-by-step instructions on adding and connecting the device before proceeding.
In the device list, click on the device row to open the device page.
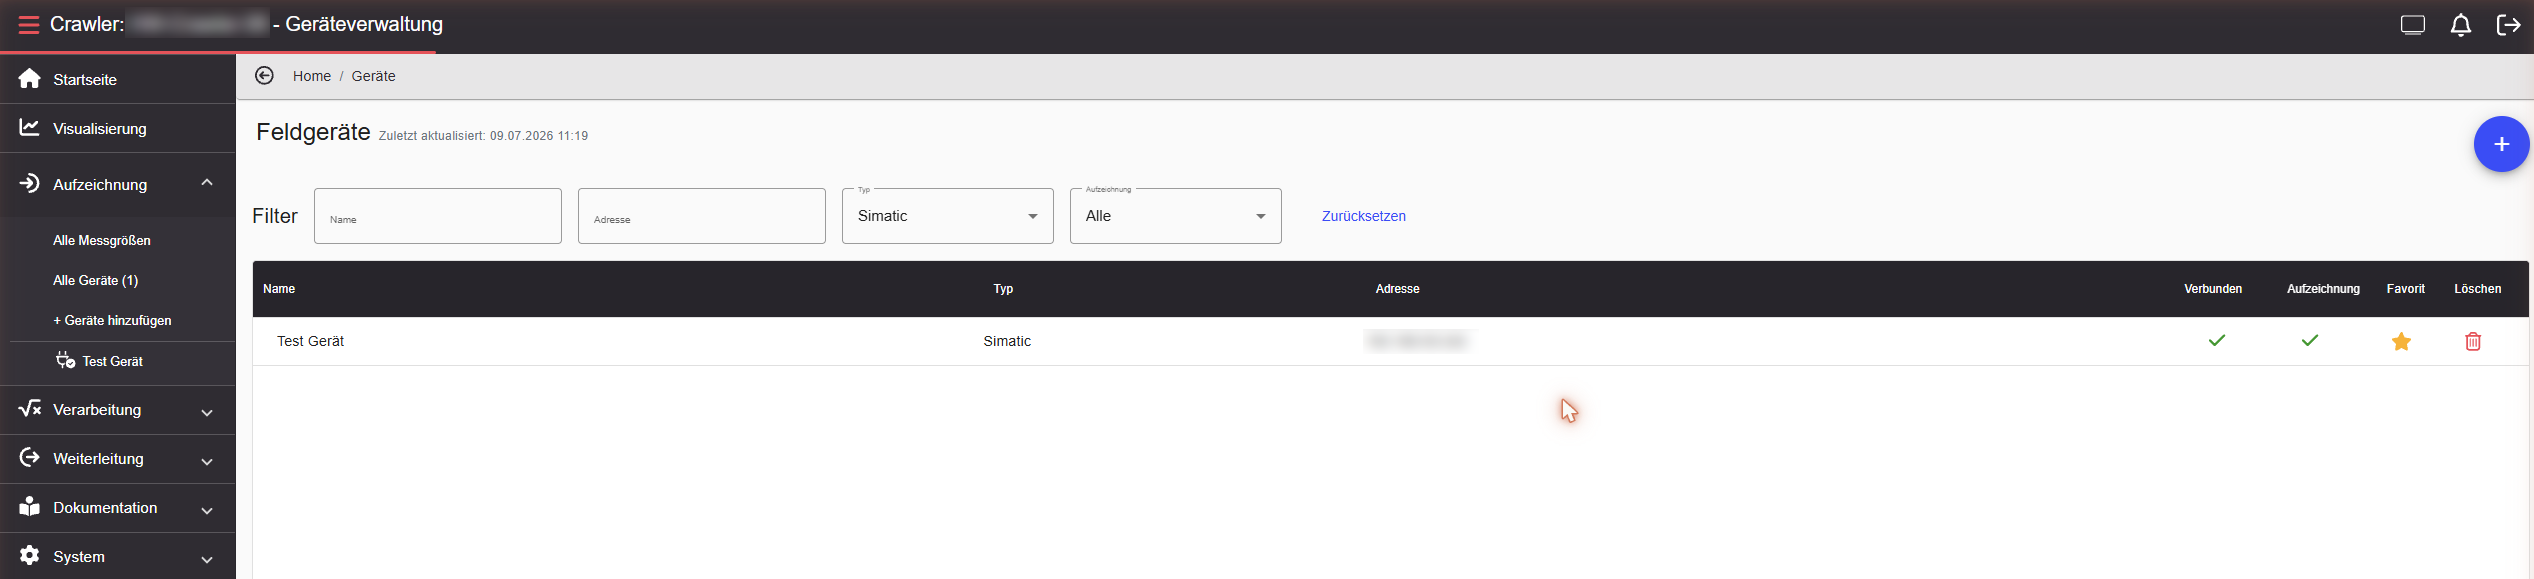
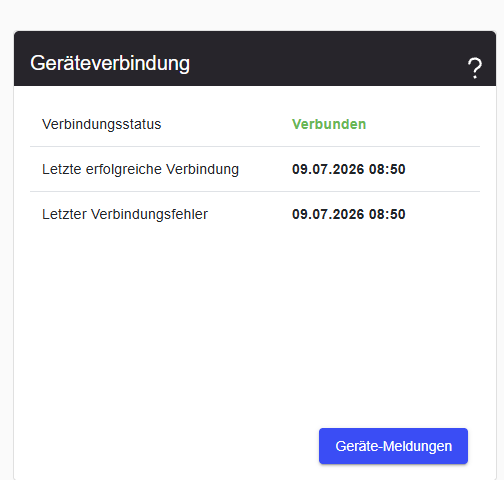
Before importing, a connection to the field device must be established. The connection status is shown in the Device connection widget on the device page.
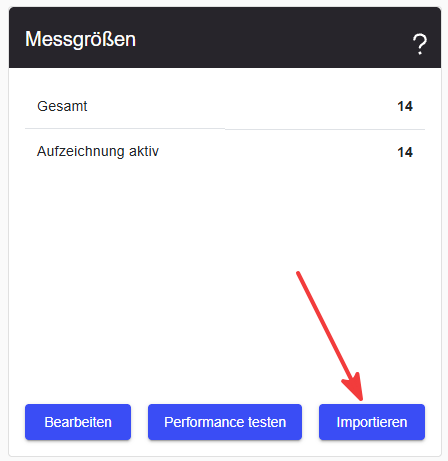
On the device page, the Measured variables widget shows the total number of configured variables and how many are currently being recorded. Click Import to open the import dialog, then select From device.
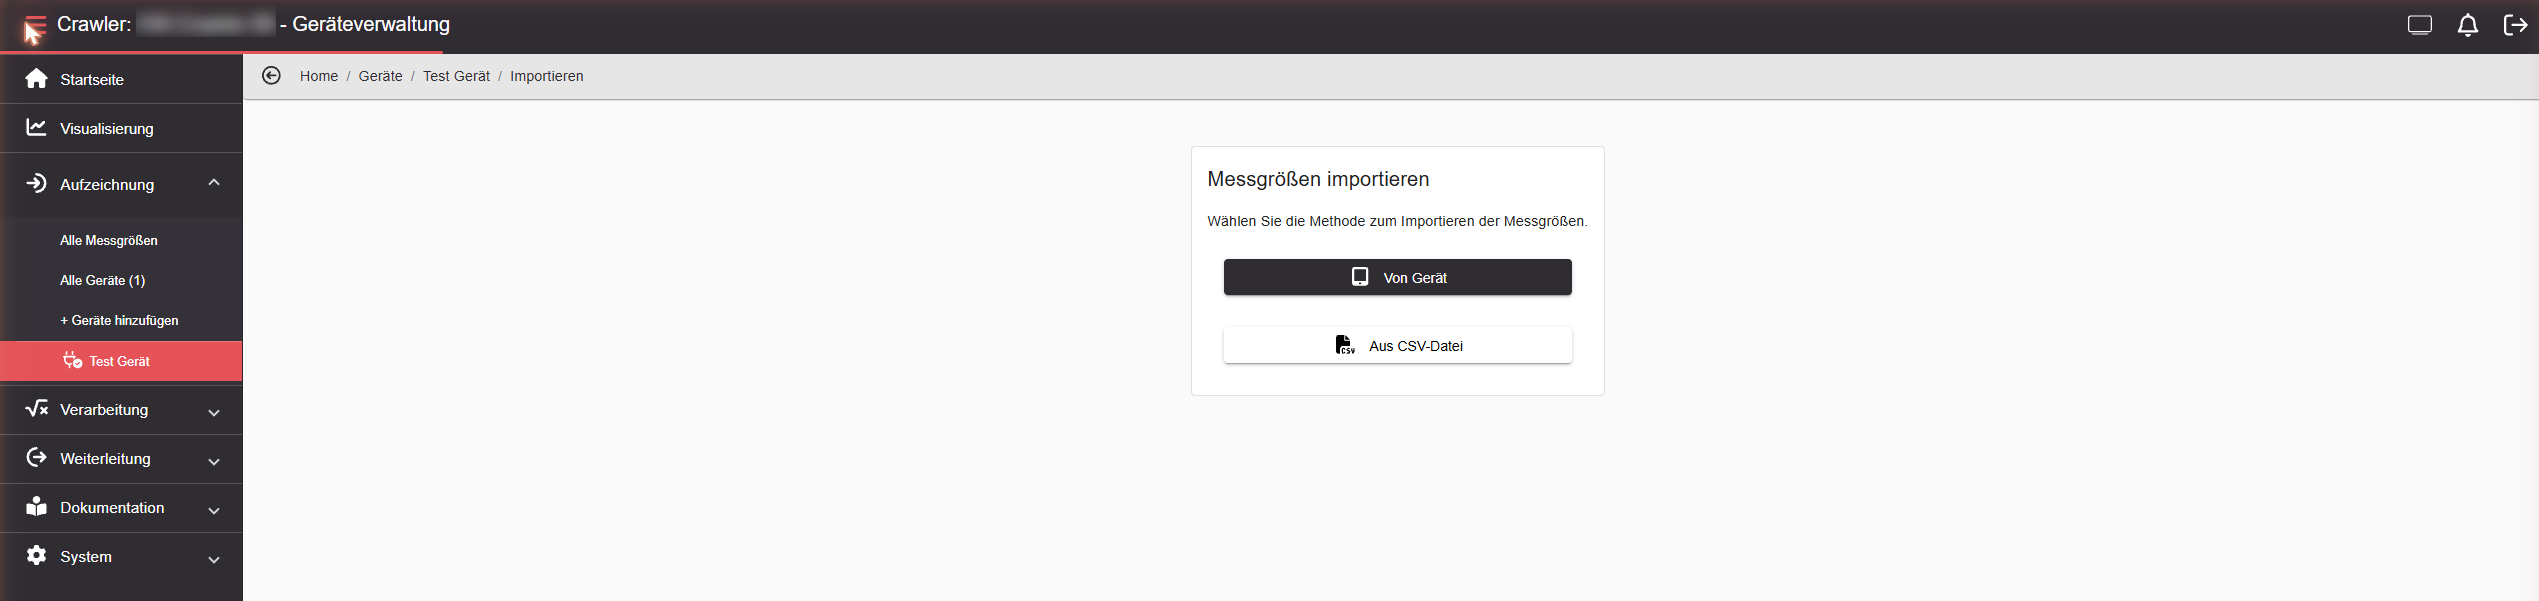
The Variable Browser then displays all available variables:
- Variables already imported are highlighted in grey
- Variables configured on the Edge but not found on the field device during import are highlighted in yellow
Select all desired measured variables and add them to the Cart. The cart acts as a selection buffer — variables can be added incrementally as you navigate through the device’s variable structure, and the full selection can be reviewed before the import is confirmed. Once the selection is complete, open the cart and click Import all.
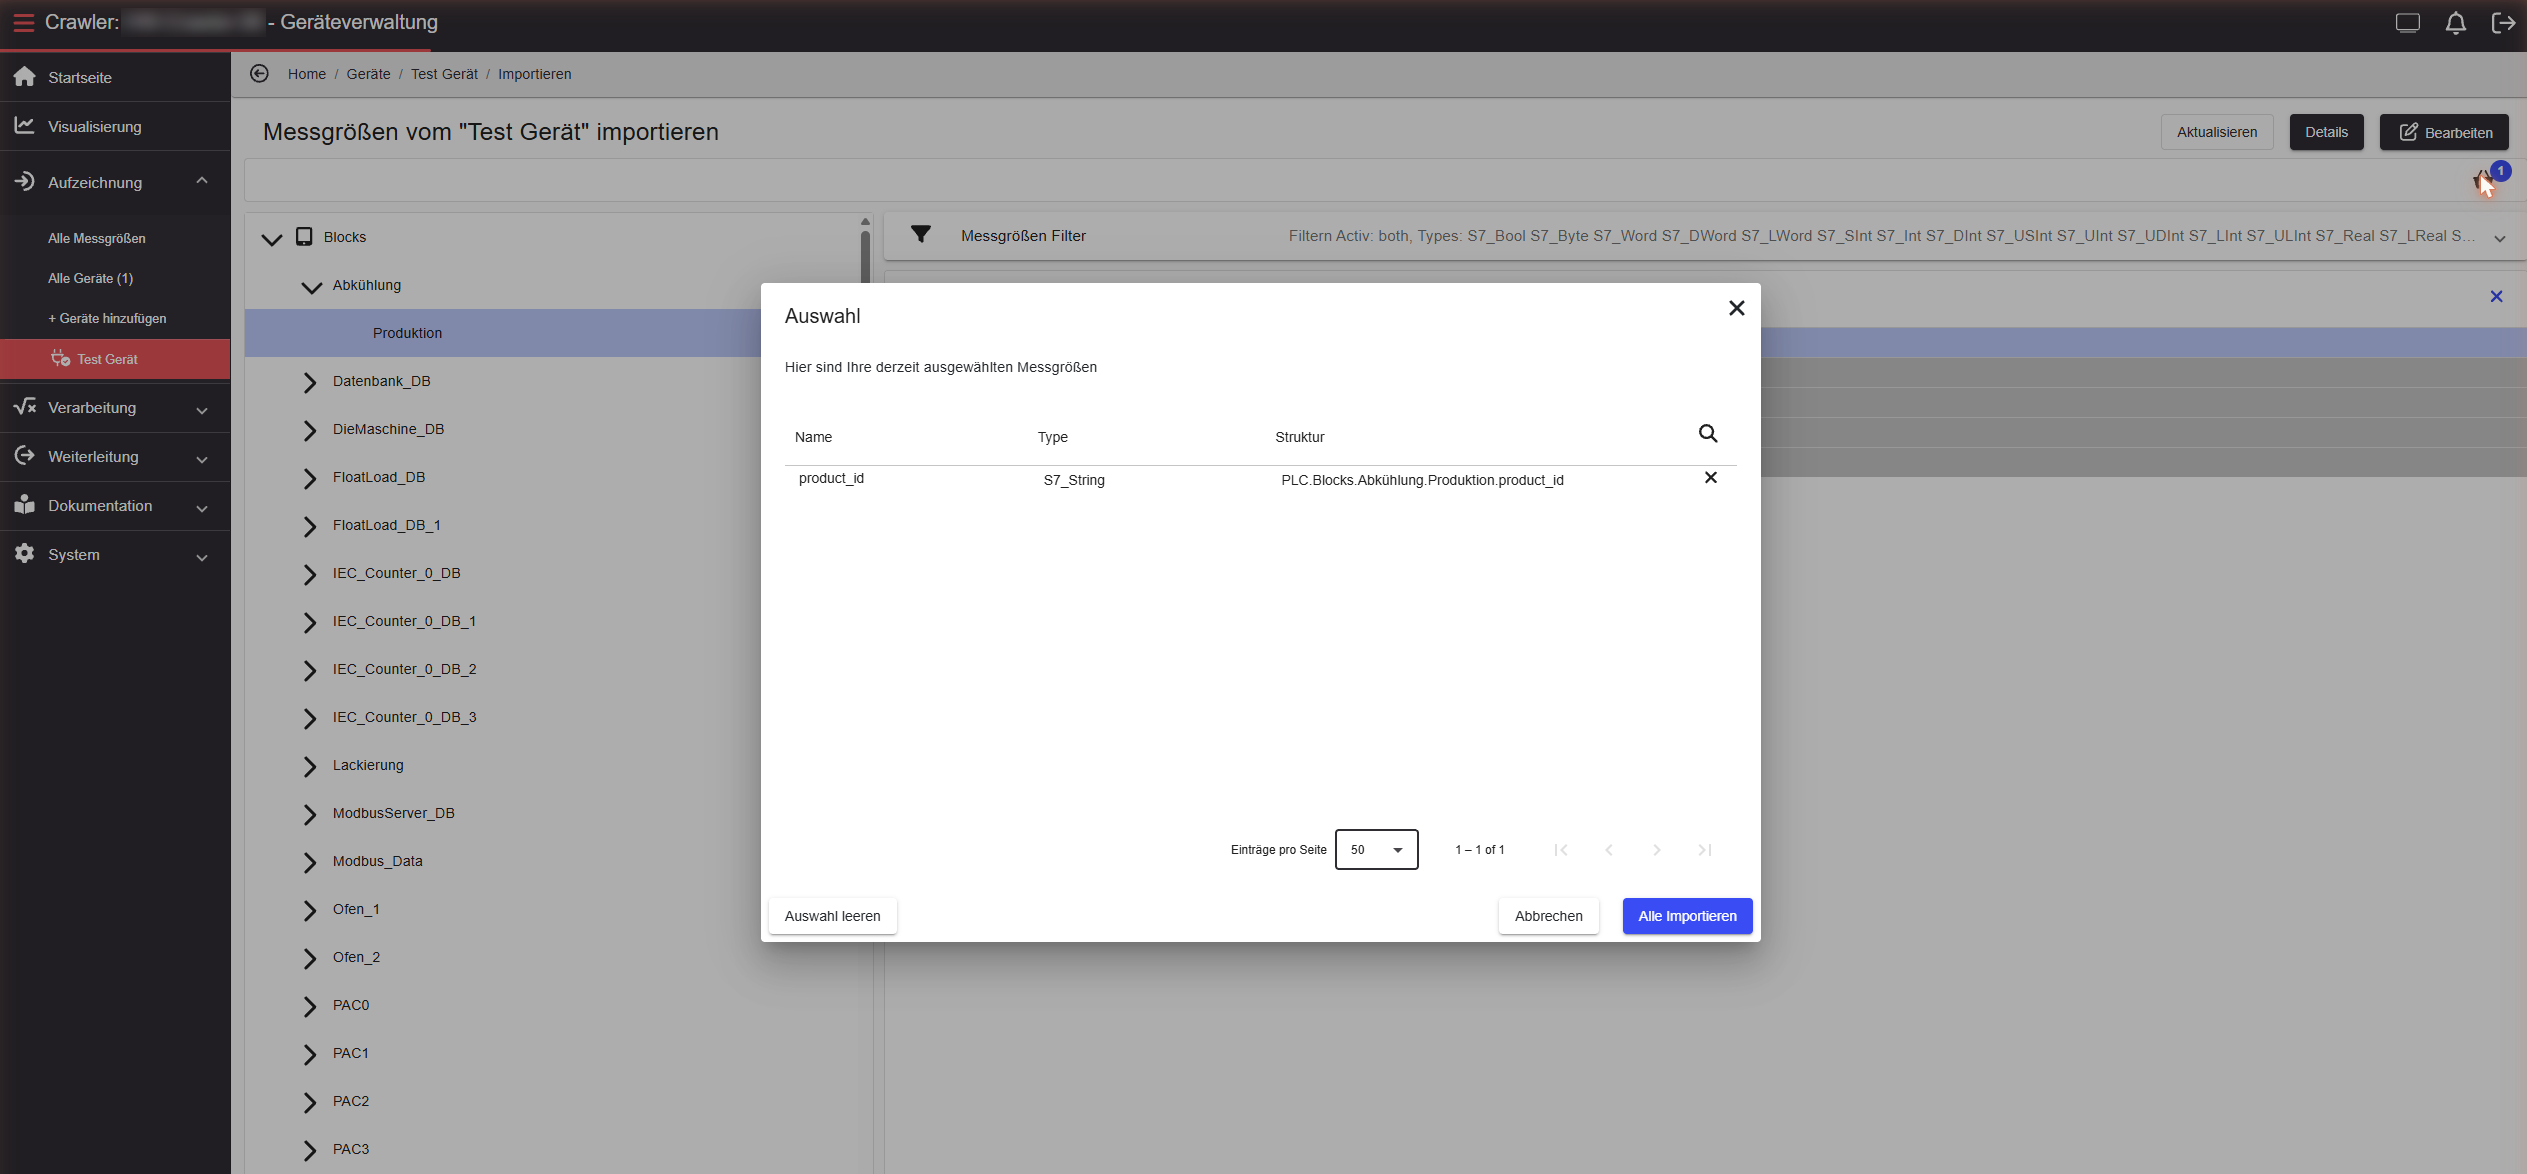
Before confirming, set the desired configuration for the imported variables — sampling interval, recording state, and timestamp alignment can all be applied globally to all imported variables at once.
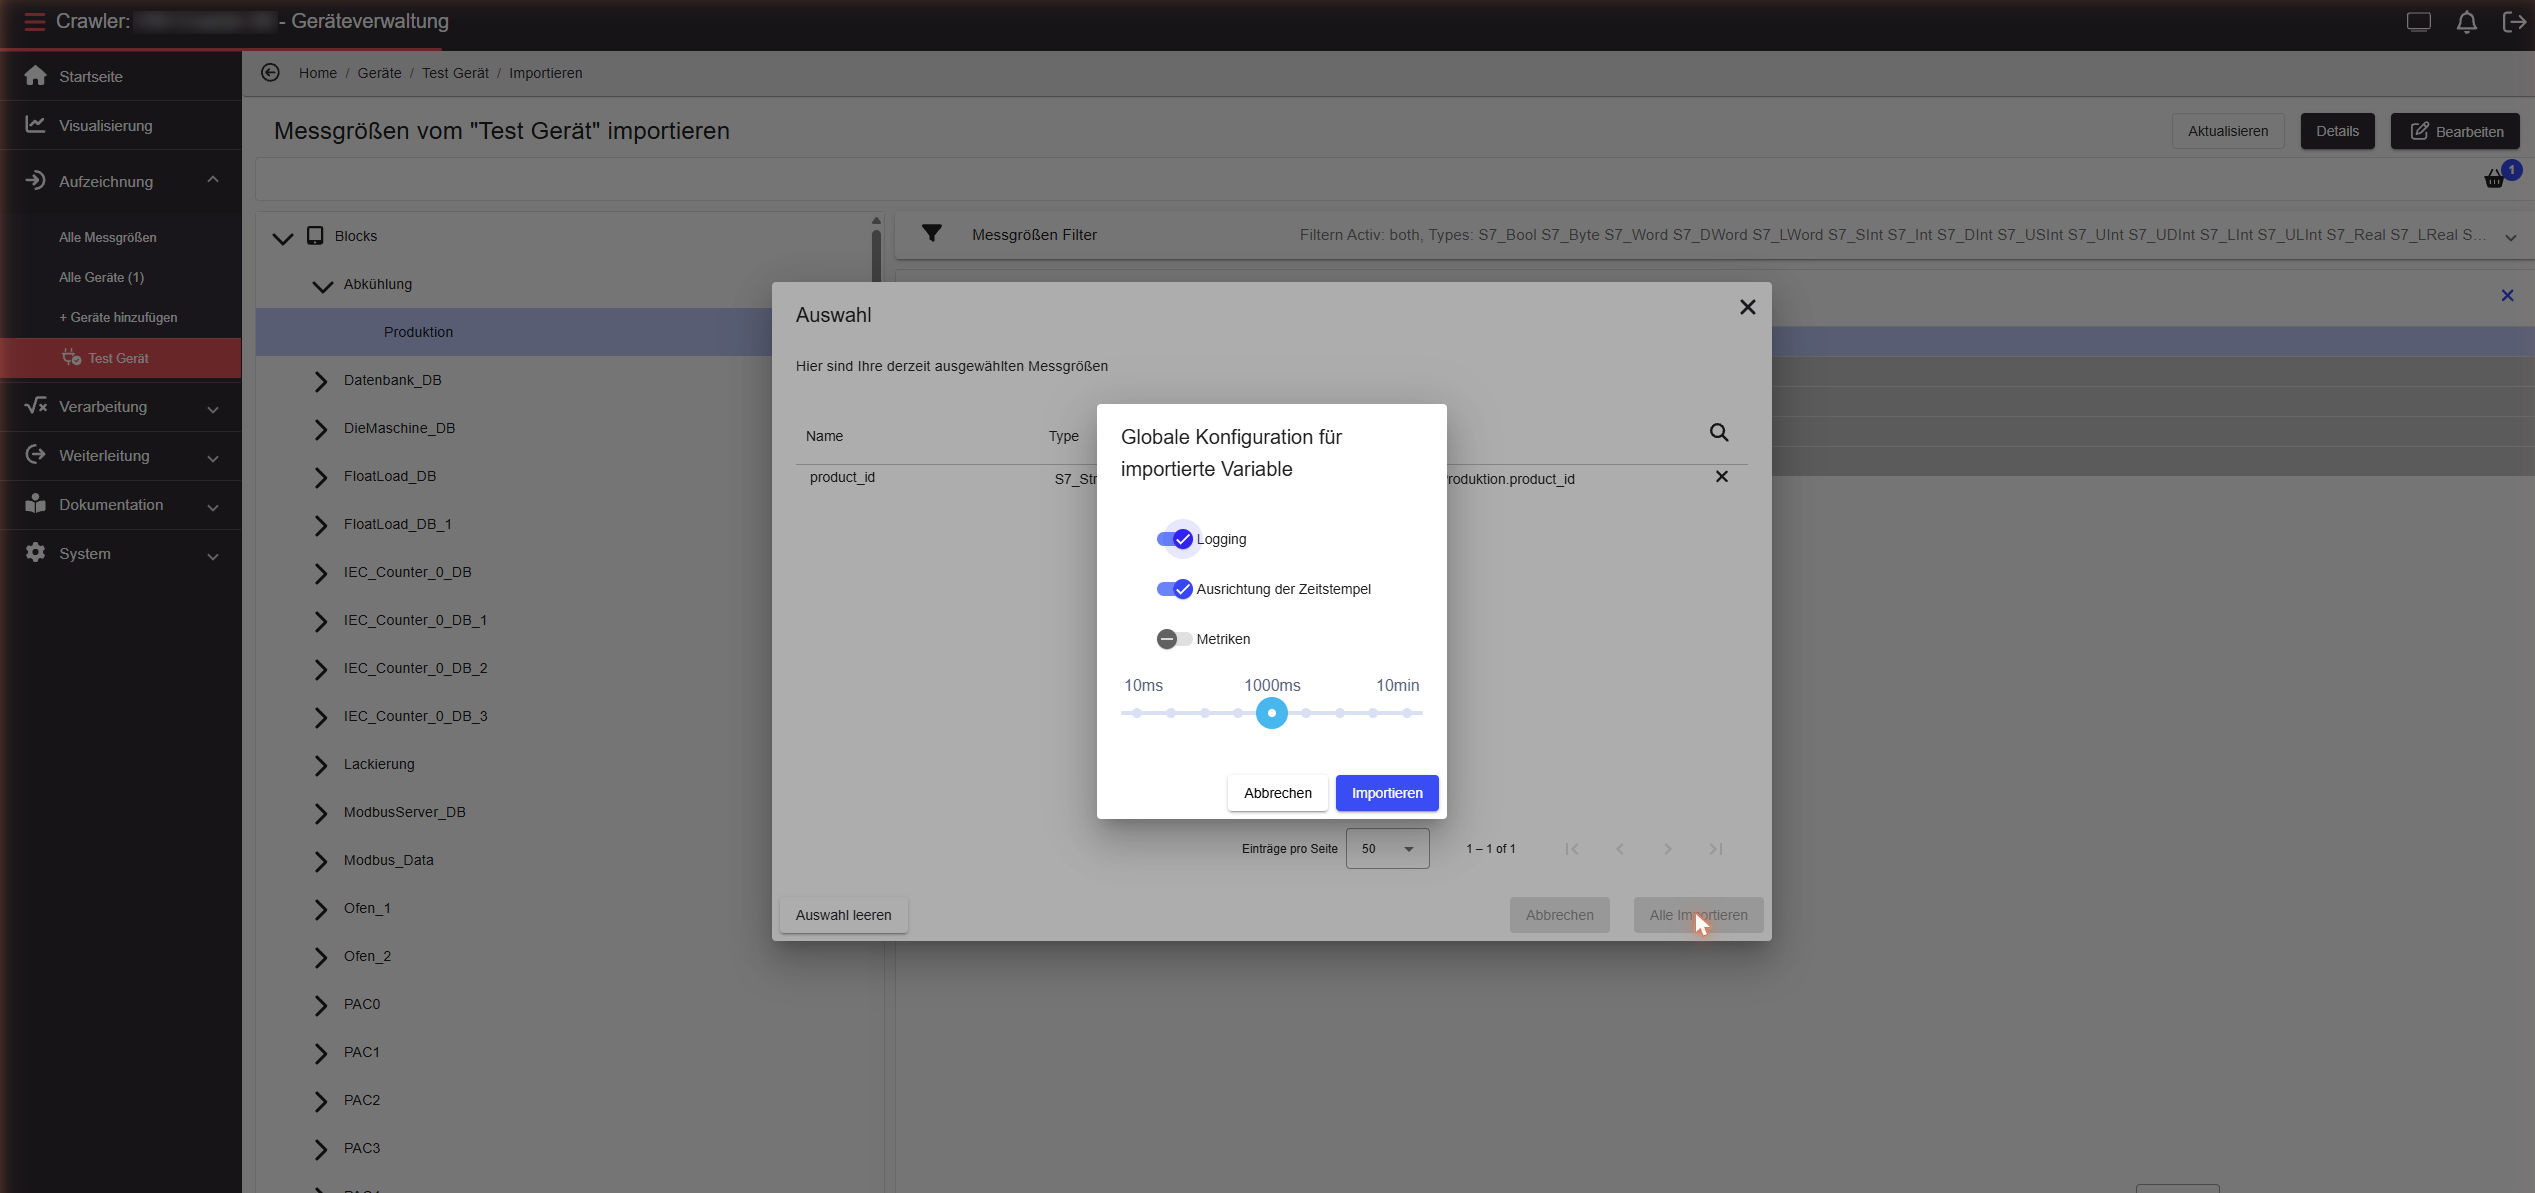
Click Import to confirm. The imported variables are added to the device immediately and begin recording at the configured sampling interval.
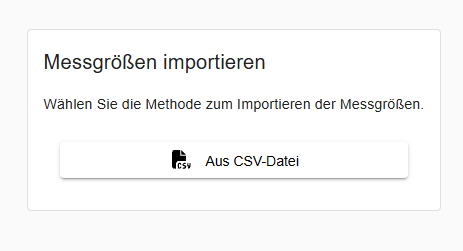
The CSV import allows variables to be created from a spreadsheet file — available for all device types and as an alternative when the device import is not supported or fails for large PLC structures.
On the device page, open the Measured variables widget, click Import, and select From CSV file.
CSV file structure
The CSV file uses semicolon (;) as the delimiter and must be UTF-8 encoded. The first row contains the column headers — spelling and spacing must match exactly.
Messgroessenname;Aktiv;Abtastrate (ms);Datentyp (SPS);Datentyp (Crawler);Gruppe;Adresse;Tagstrue or false — whether recording starts immediately after importAbtastrate (ms)Sampling interval in milliseconds, e.g. 1000Datentyp (SPS)PLC-side data type of the variable, e.g. S7_Real, S7_Bool, S7_Int, FLOAT, BOOLEANDatentyp (Crawler)Edge-side data type — typically FLOAT for numeric values or STRING for text and time valuesGruppeGroup name for organizing variables in the Variable Browser, e.g. Motor1 or PAC0AdresseVariable address in the device-specific format (see address formats below)TagsOptional tags, comma-separated — can be left emptyExample (S7 absolute)
Messgroessenname;Aktiv;Abtastrate (ms);Datentyp (SPS);Datentyp (Crawler);Gruppe;Adresse;TagsTemperatur;true;1000;S7_Real;FLOAT;Kessel1;DB10.DBD4.0;Ventil_auf;true;500;S7_Bool;FLOAT;Kessel1;DB10.DBX0.0;Drehzahl;false;2000;S7_DInt;FLOAT;Antriebe;DB20.DBD0.0;Ready-to-use example files for all device types are available for download below.
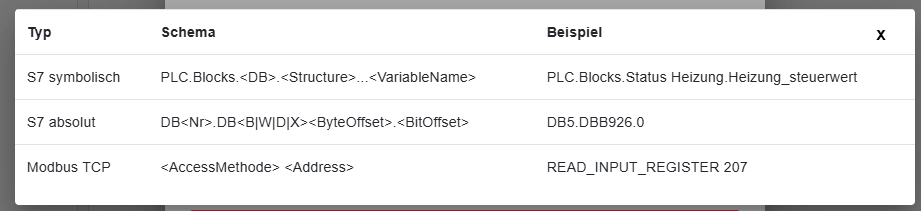
Address formats by device type
Example files
The following files can be used as templates or for testing the CSV import:
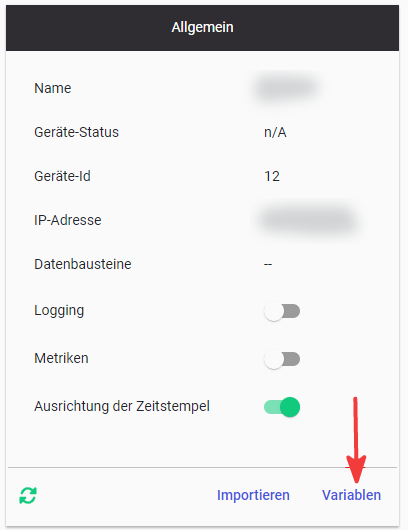
To access the measured variables of a device, open the device page and click the variables link.
Manually creating a variable
Before variables can be created manually, at least one root group (top-level group) must exist in the device. Without a root group, adding variables is not possible.
Step 1 — Create a root group
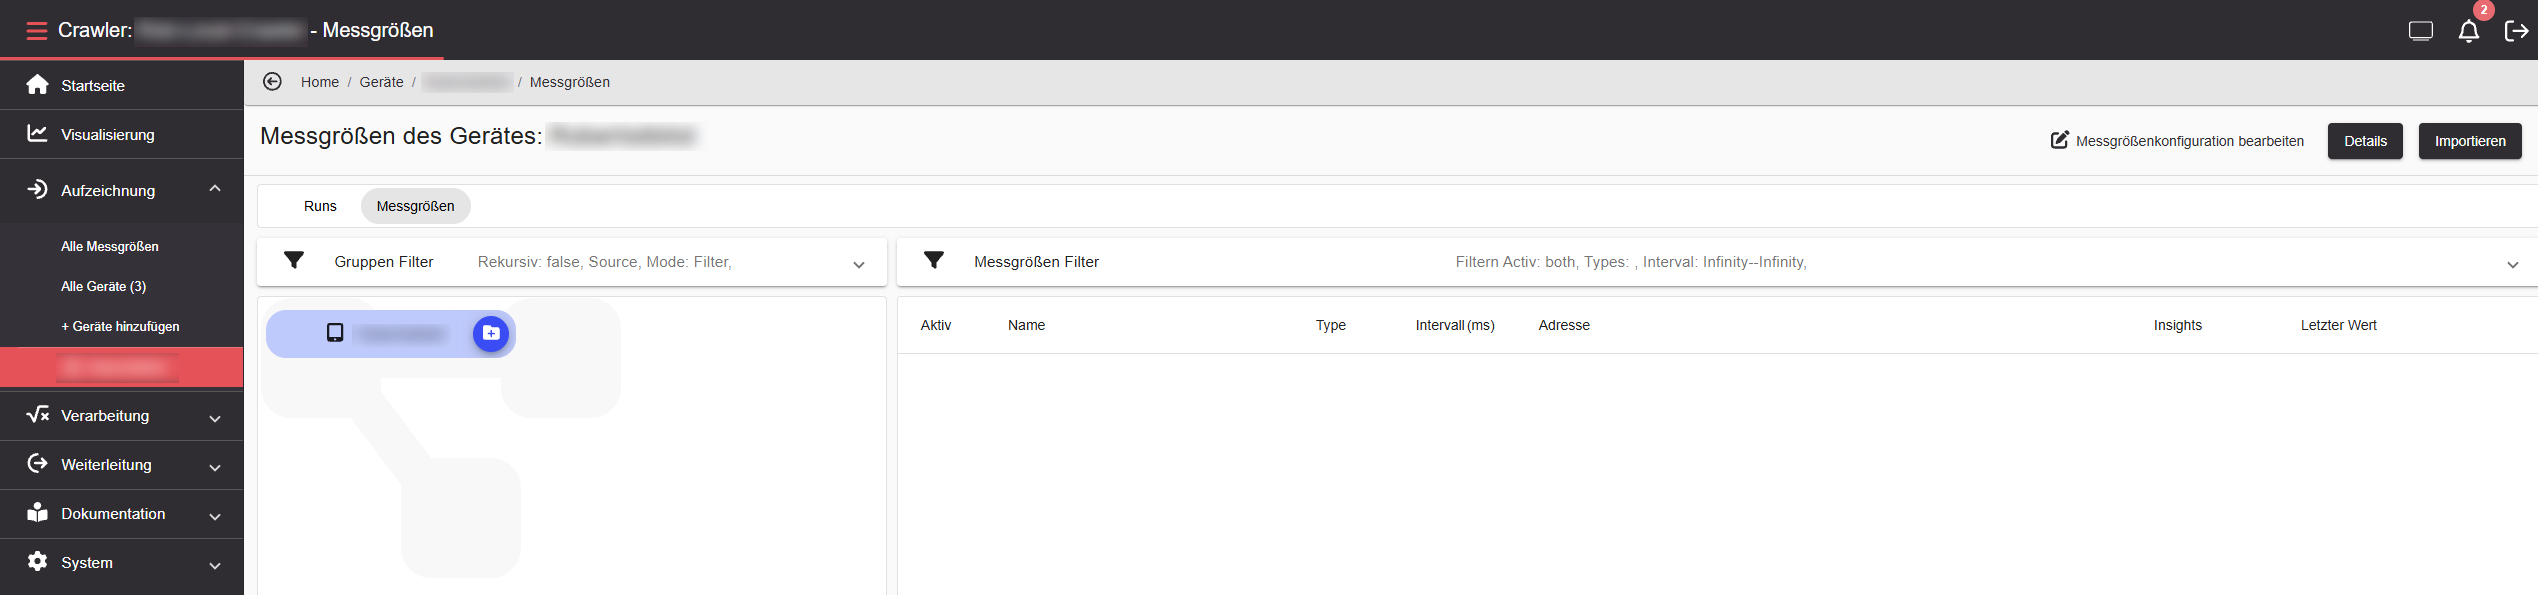
The Variable Browser initially shows only the device with no groups or variables.
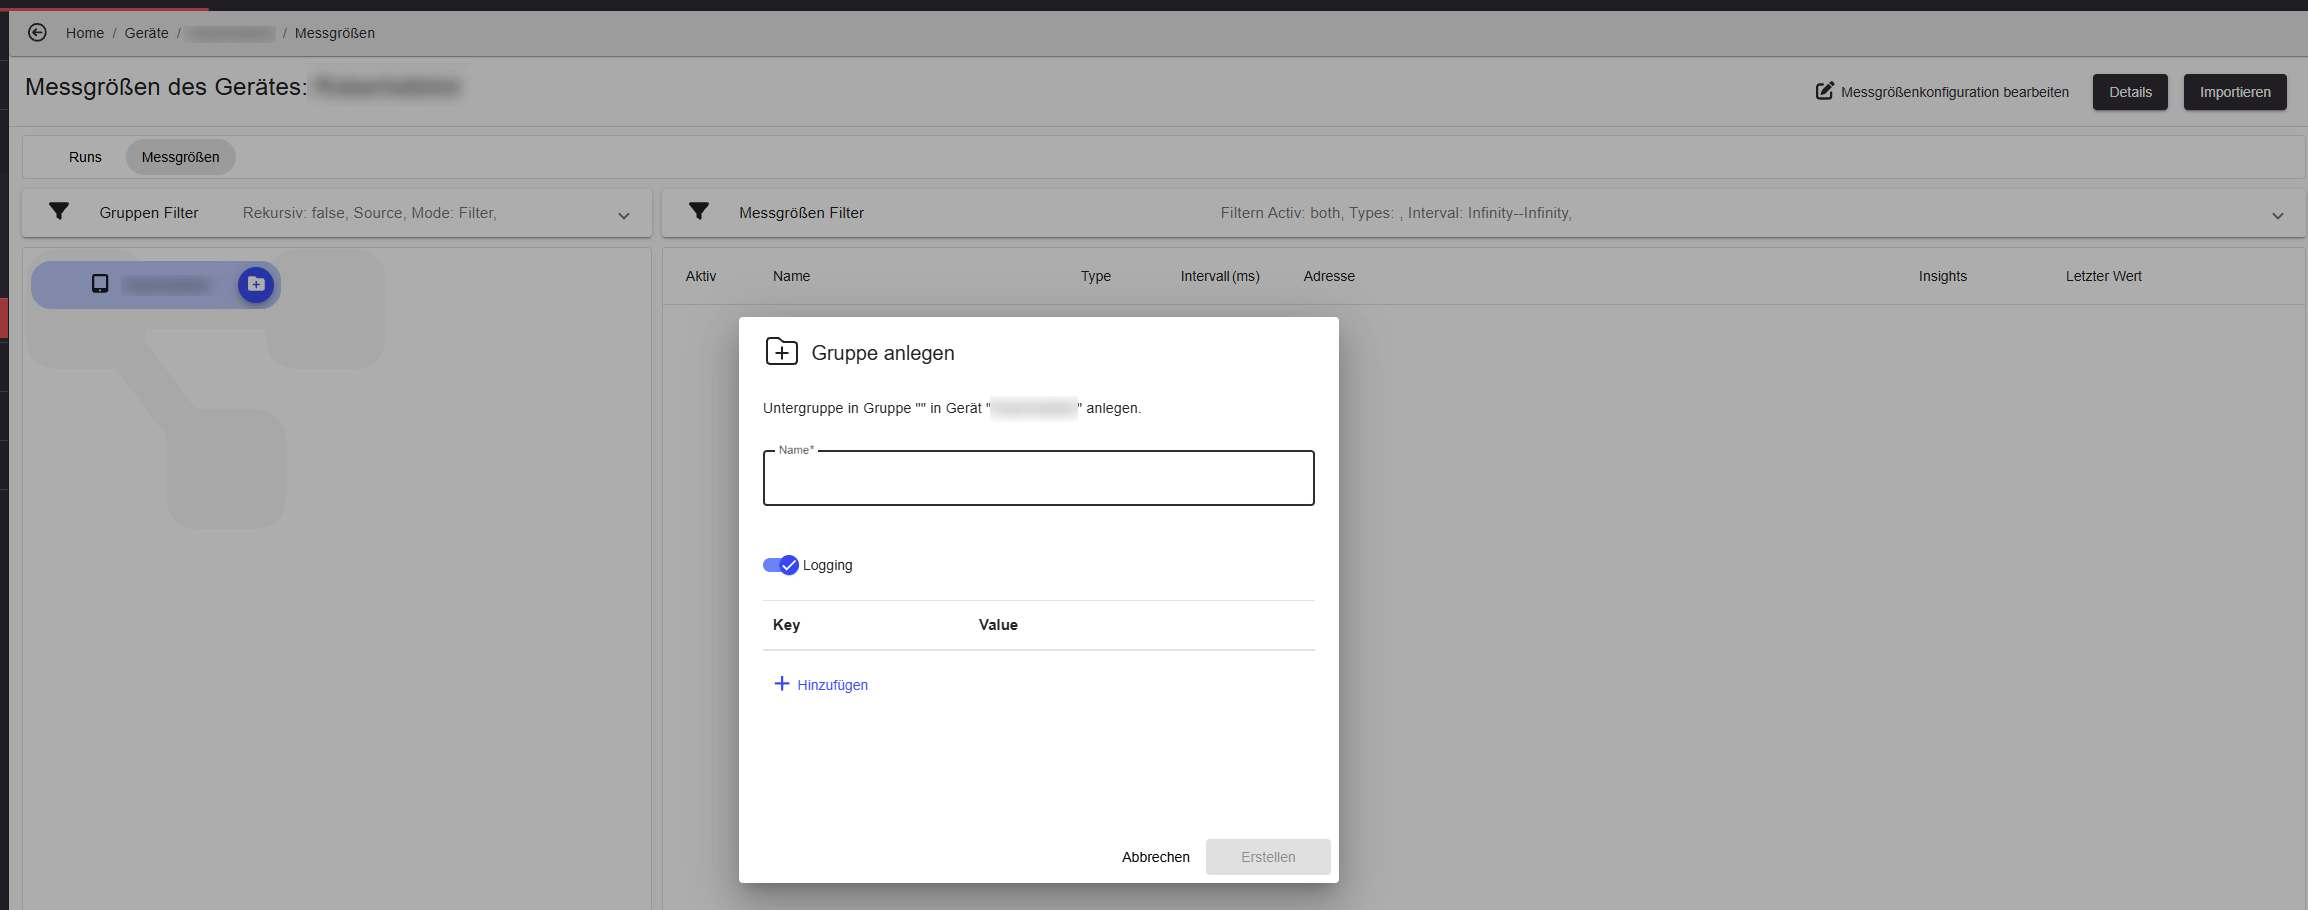
Click the + icon next to the device to create a new group. Enter the group name and click Create.
Step 2 — Add a variable
Once at least one group exists, select the group and click + Add variable. Enter the variable name, address, data type, and sampling interval.
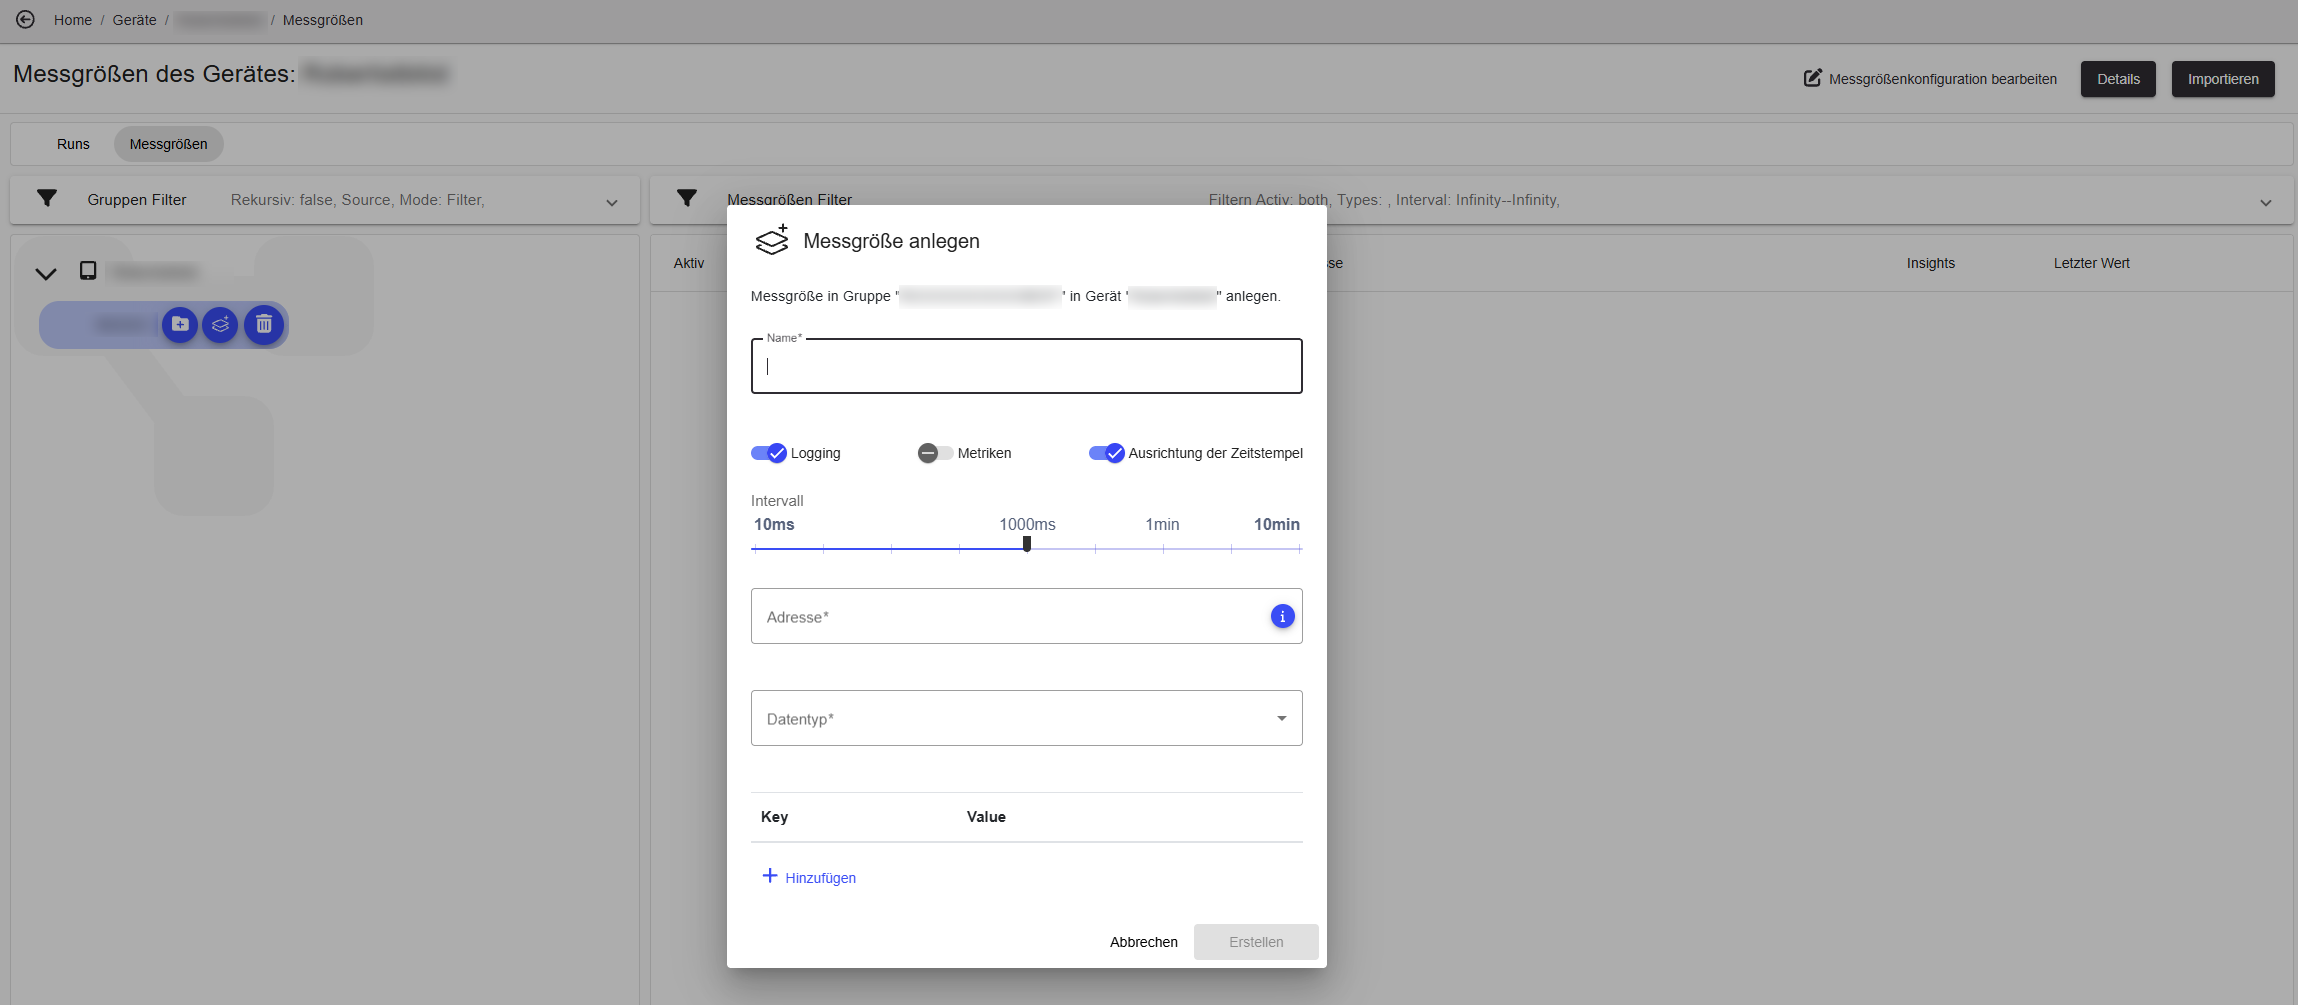
The address format depends on the device type:
A correctly configured variable appears in the list with its type, address, sampling interval, and last recorded value.

Editing or deleting a single variable
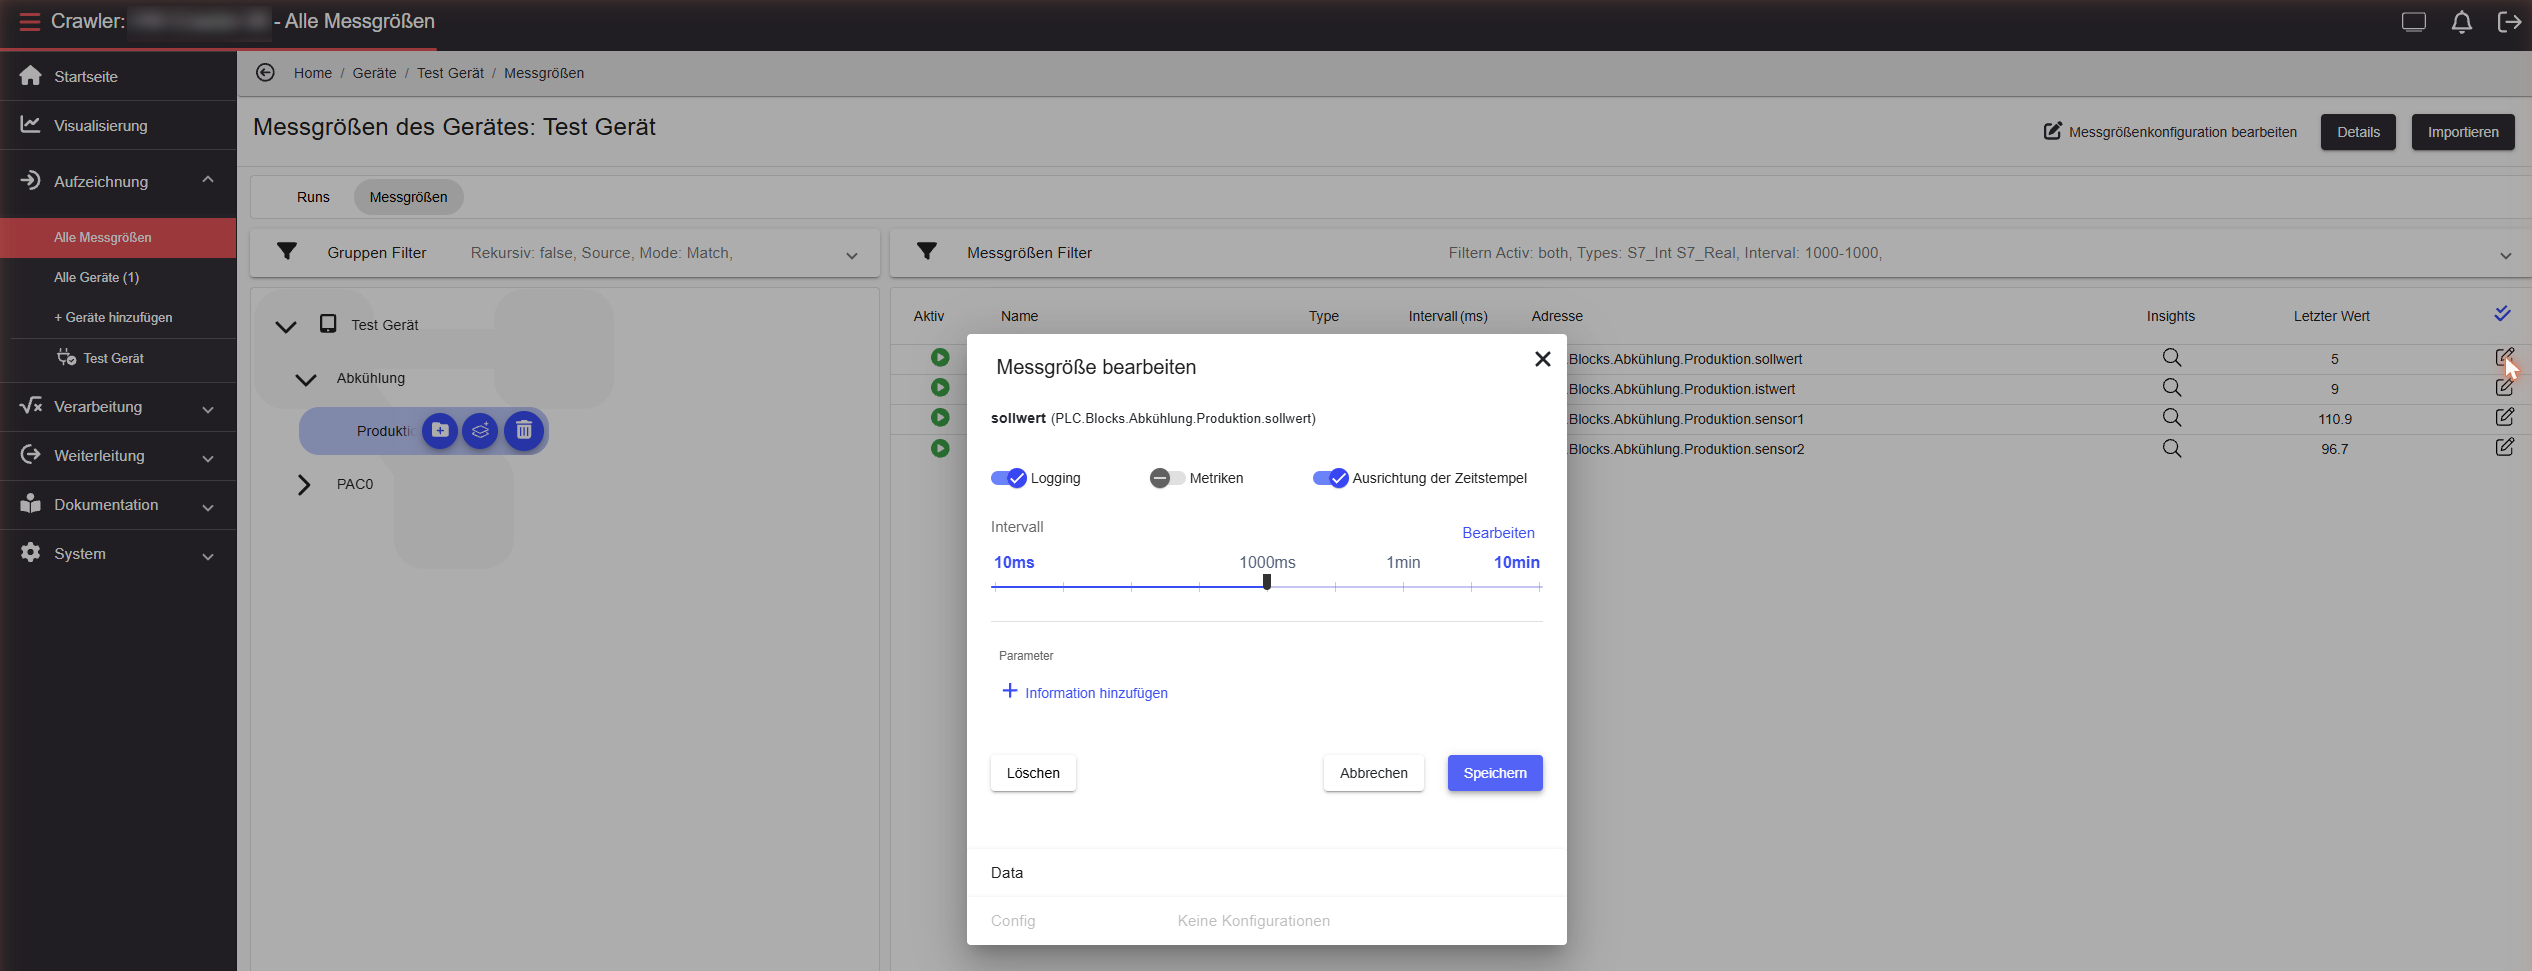
The following settings can be changed for a measured variable:
Variables can be edited inline directly in the Variable Browser (name and sampling rate). For all other settings, open the edit dialog via the icon next to the variable.

Bulk editing or deleting
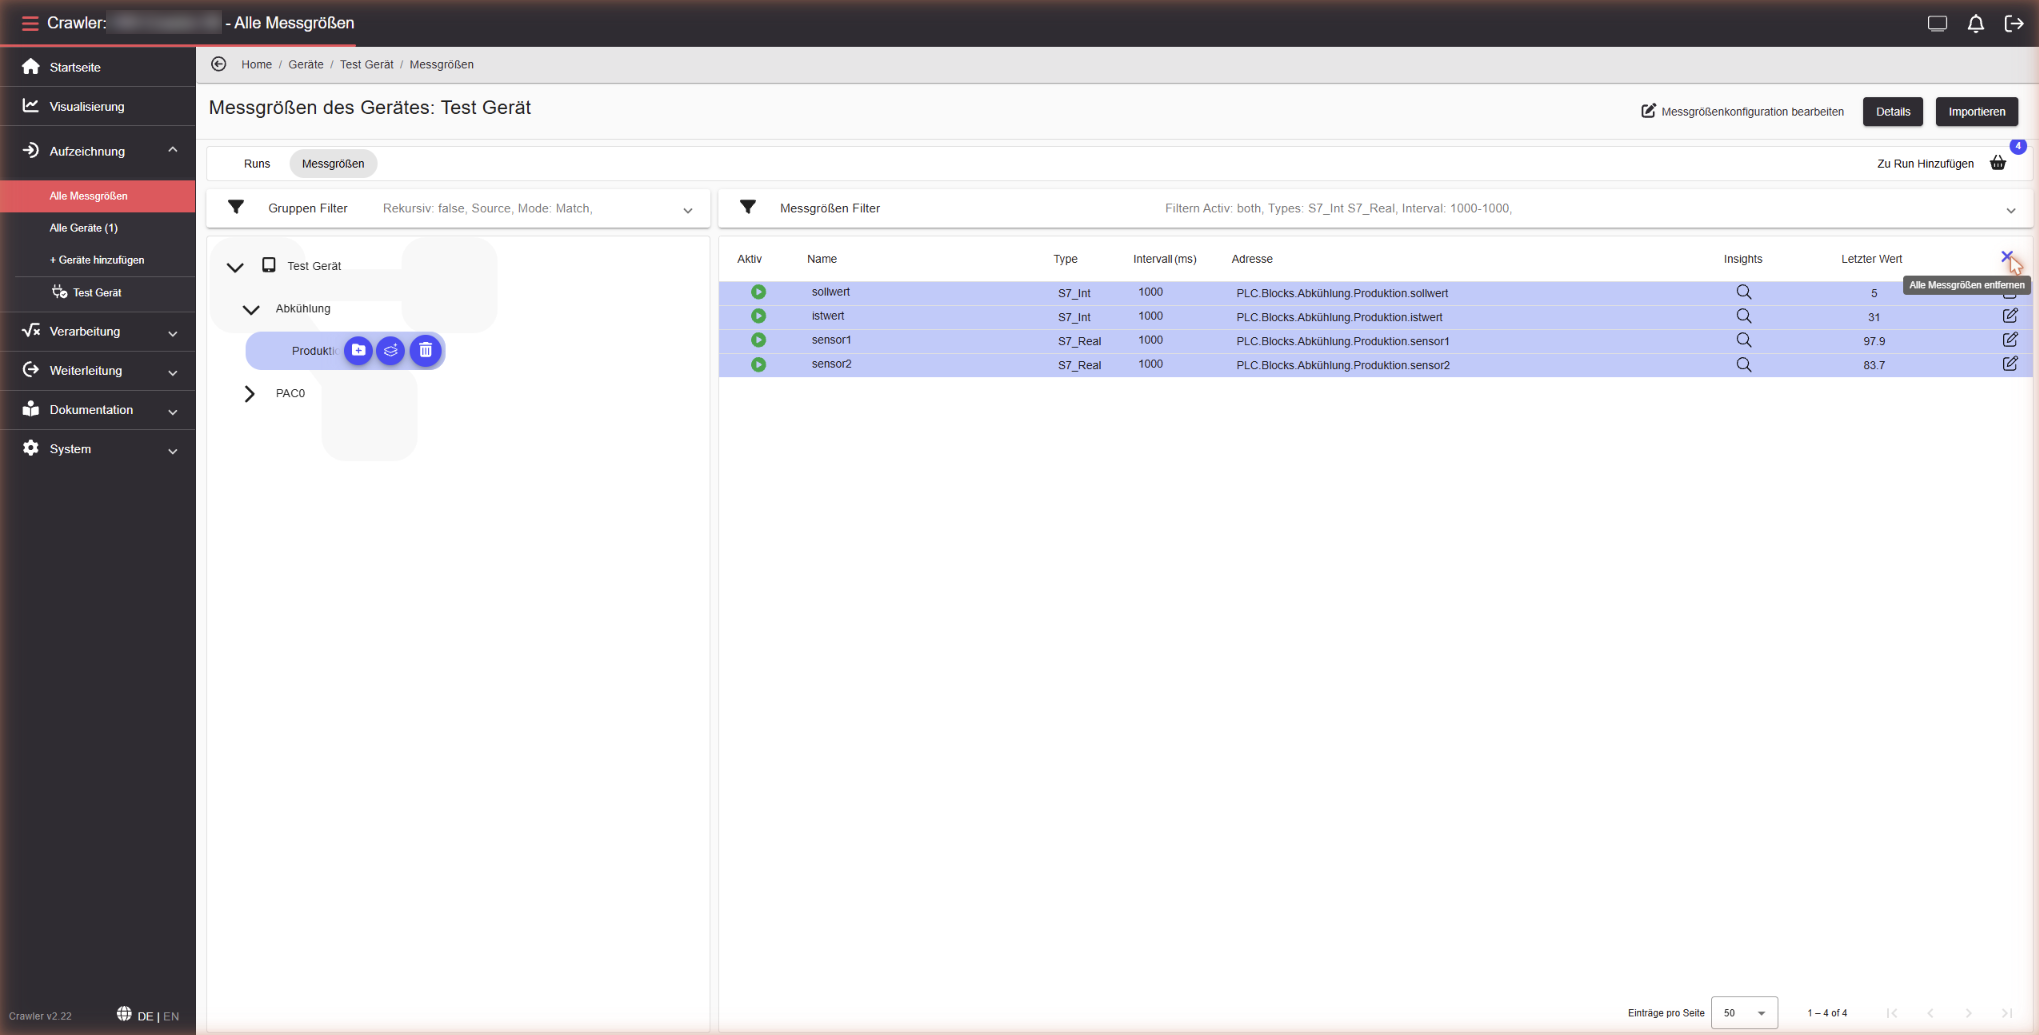
To edit or delete multiple variables at once, select them in the Variable Browser by adding them to the cart. Selected variables are highlighted in color; the number of selected items is shown on the cart icon. Open the cart to review and adjust the selection. Removing a variable from the cart does not delete it.
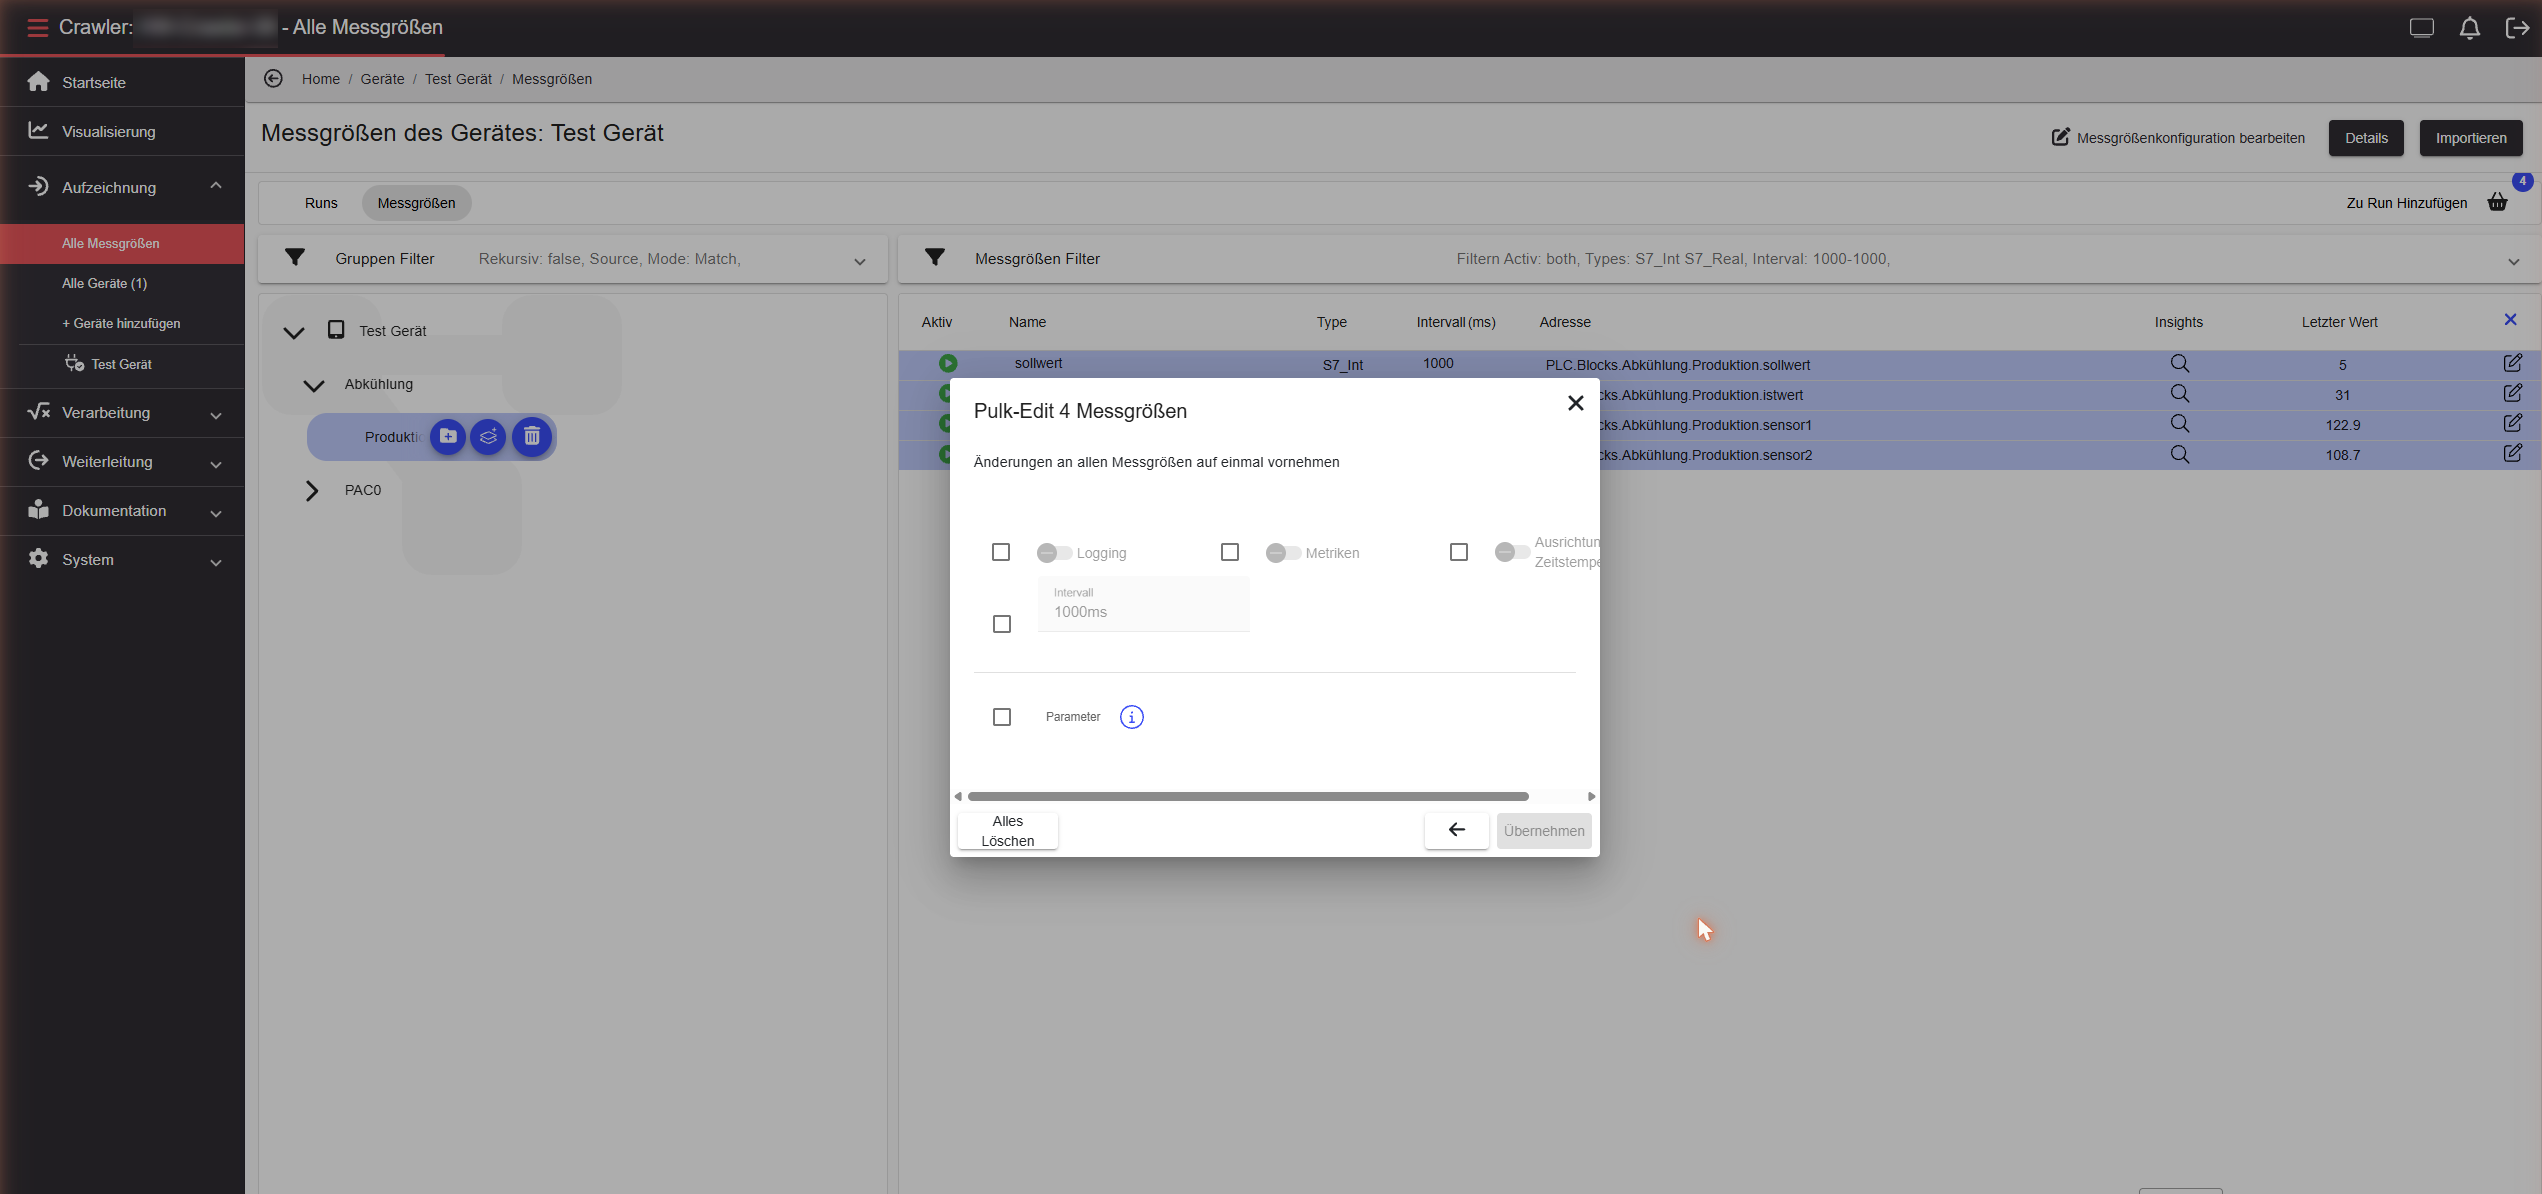
Click Edit all to open the bulk edit dialog. Individual settings can be overwritten for all selected variables at once.
If the current values differ across the selection, this is indicated.
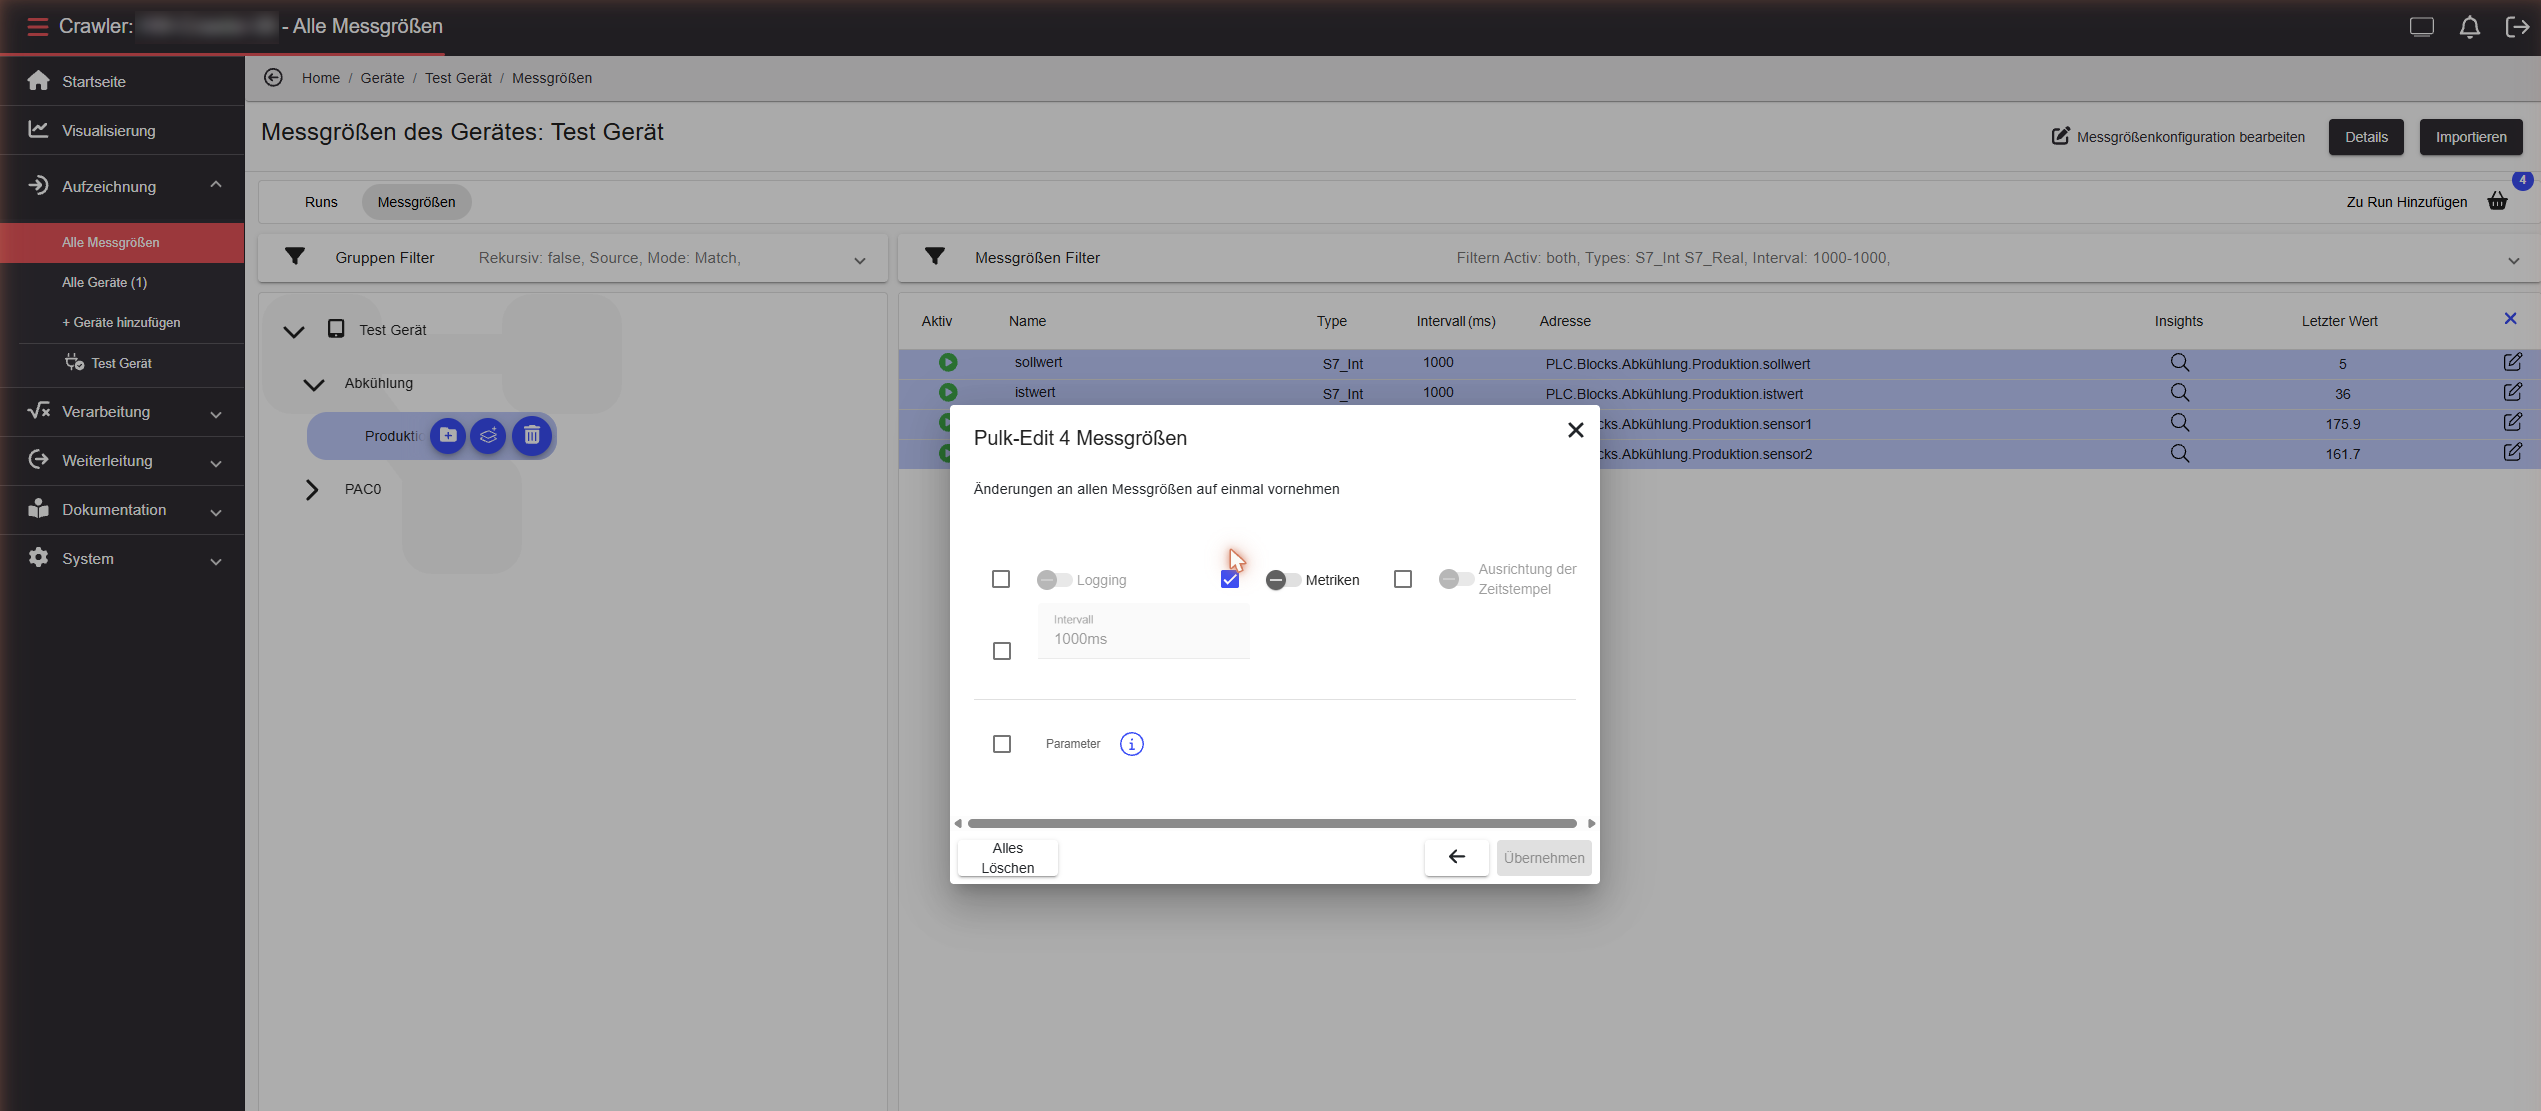
After applying changes, the cart remains open for further edits or can be closed.
The Performance Analysis tool tests whether the Edge is sampling variables at the configured rate. It checks that no values are missed or delayed — useful after setup or when adjusting sampling intervals.
Open the device page and click Performance Analysis to open the analysis overview. The last test result is shown alongside the available test types.
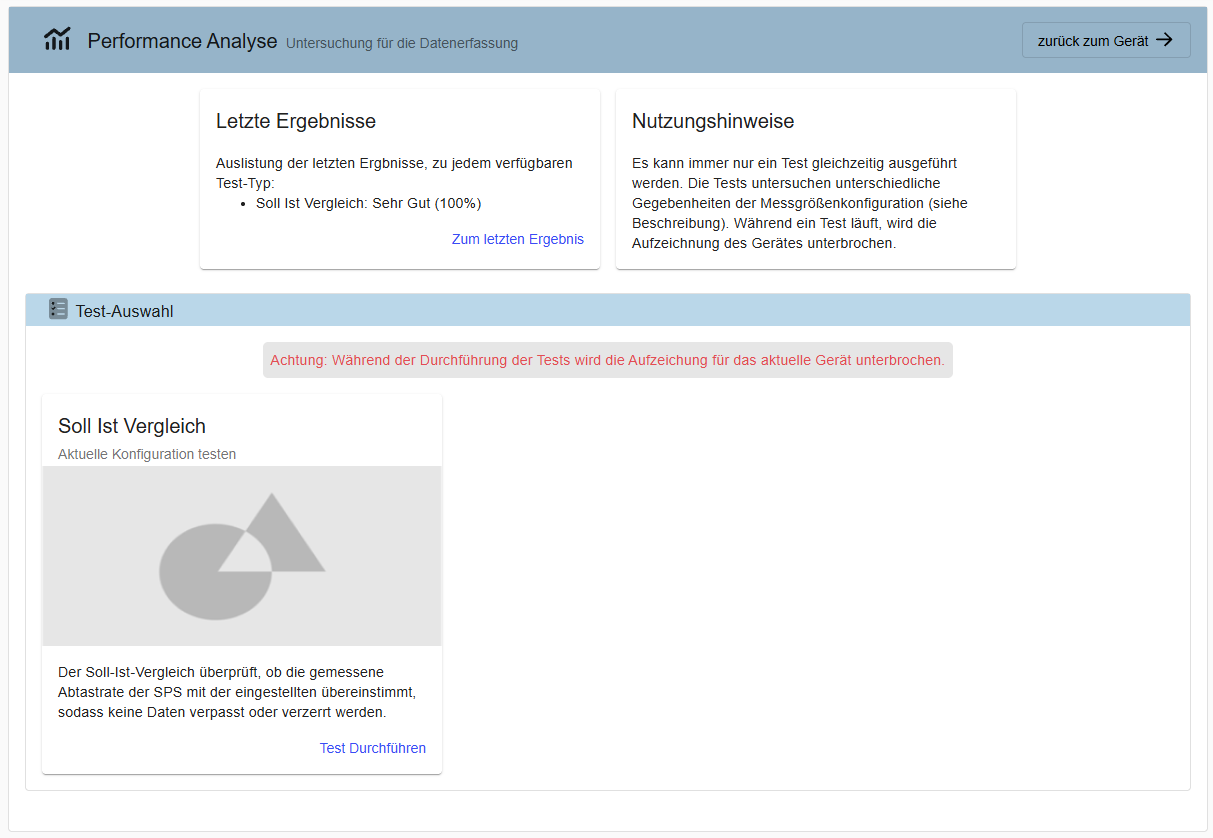
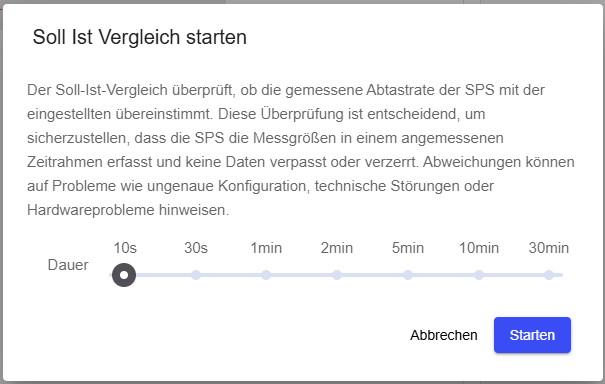
Click Run test under Setpoint-Actual Comparison to open the configuration dialog. Select a test duration using the slider (10 seconds to 30 minutes) and click Start.
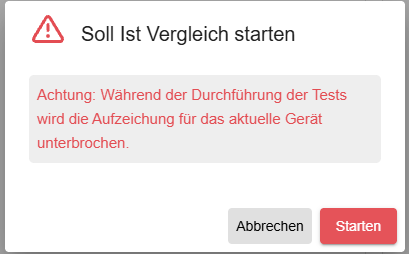
A warning is shown before the test starts confirming that recording will be interrupted.
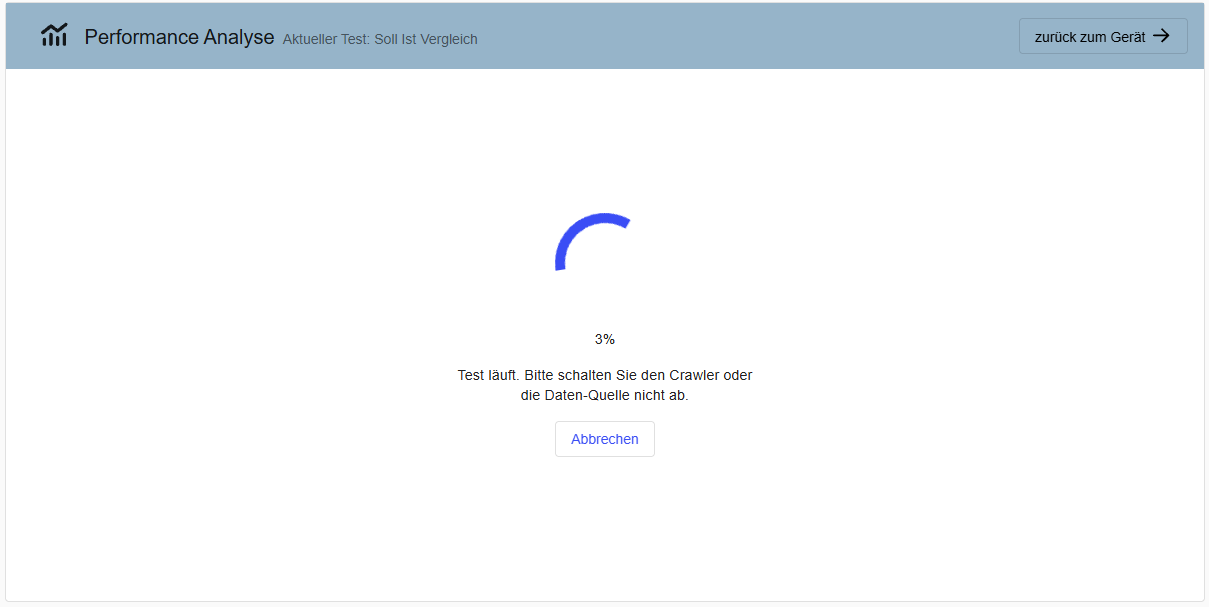
The test runs in the background and shows a progress indicator. Do not switch off the Edge or the data source while the test is running.
After completion, the results page shows a quality rating (color scale from red to green), the number of failed test runs, and key statistics including average, median, minimum, and maximum sampling rate.
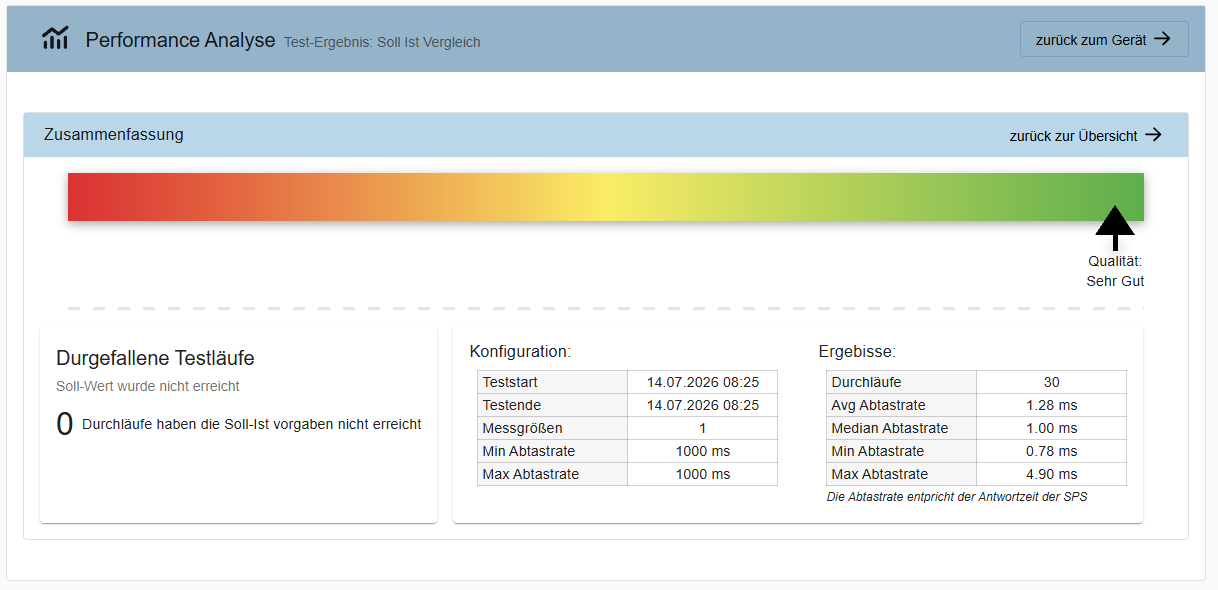
If the quality rating is poor (red or orange), the most common causes are a sampling interval that is too short relative to the network round-trip time to the field device, or a high number of simultaneously recorded variables exceeding the available bandwidth. In these cases, consider increasing the sampling interval, reducing the number of actively recorded variables on the device, or running the test on individual variables to isolate the bottleneck. Contact support if the issue persists after adjusting the configuration.