

Quickstart
A brief overview of what you can do with Edge.
Open a browser and enter the IP address of your Edge device. The web interface opens directly — no additional software required. After connecting, you land on the Home screen.
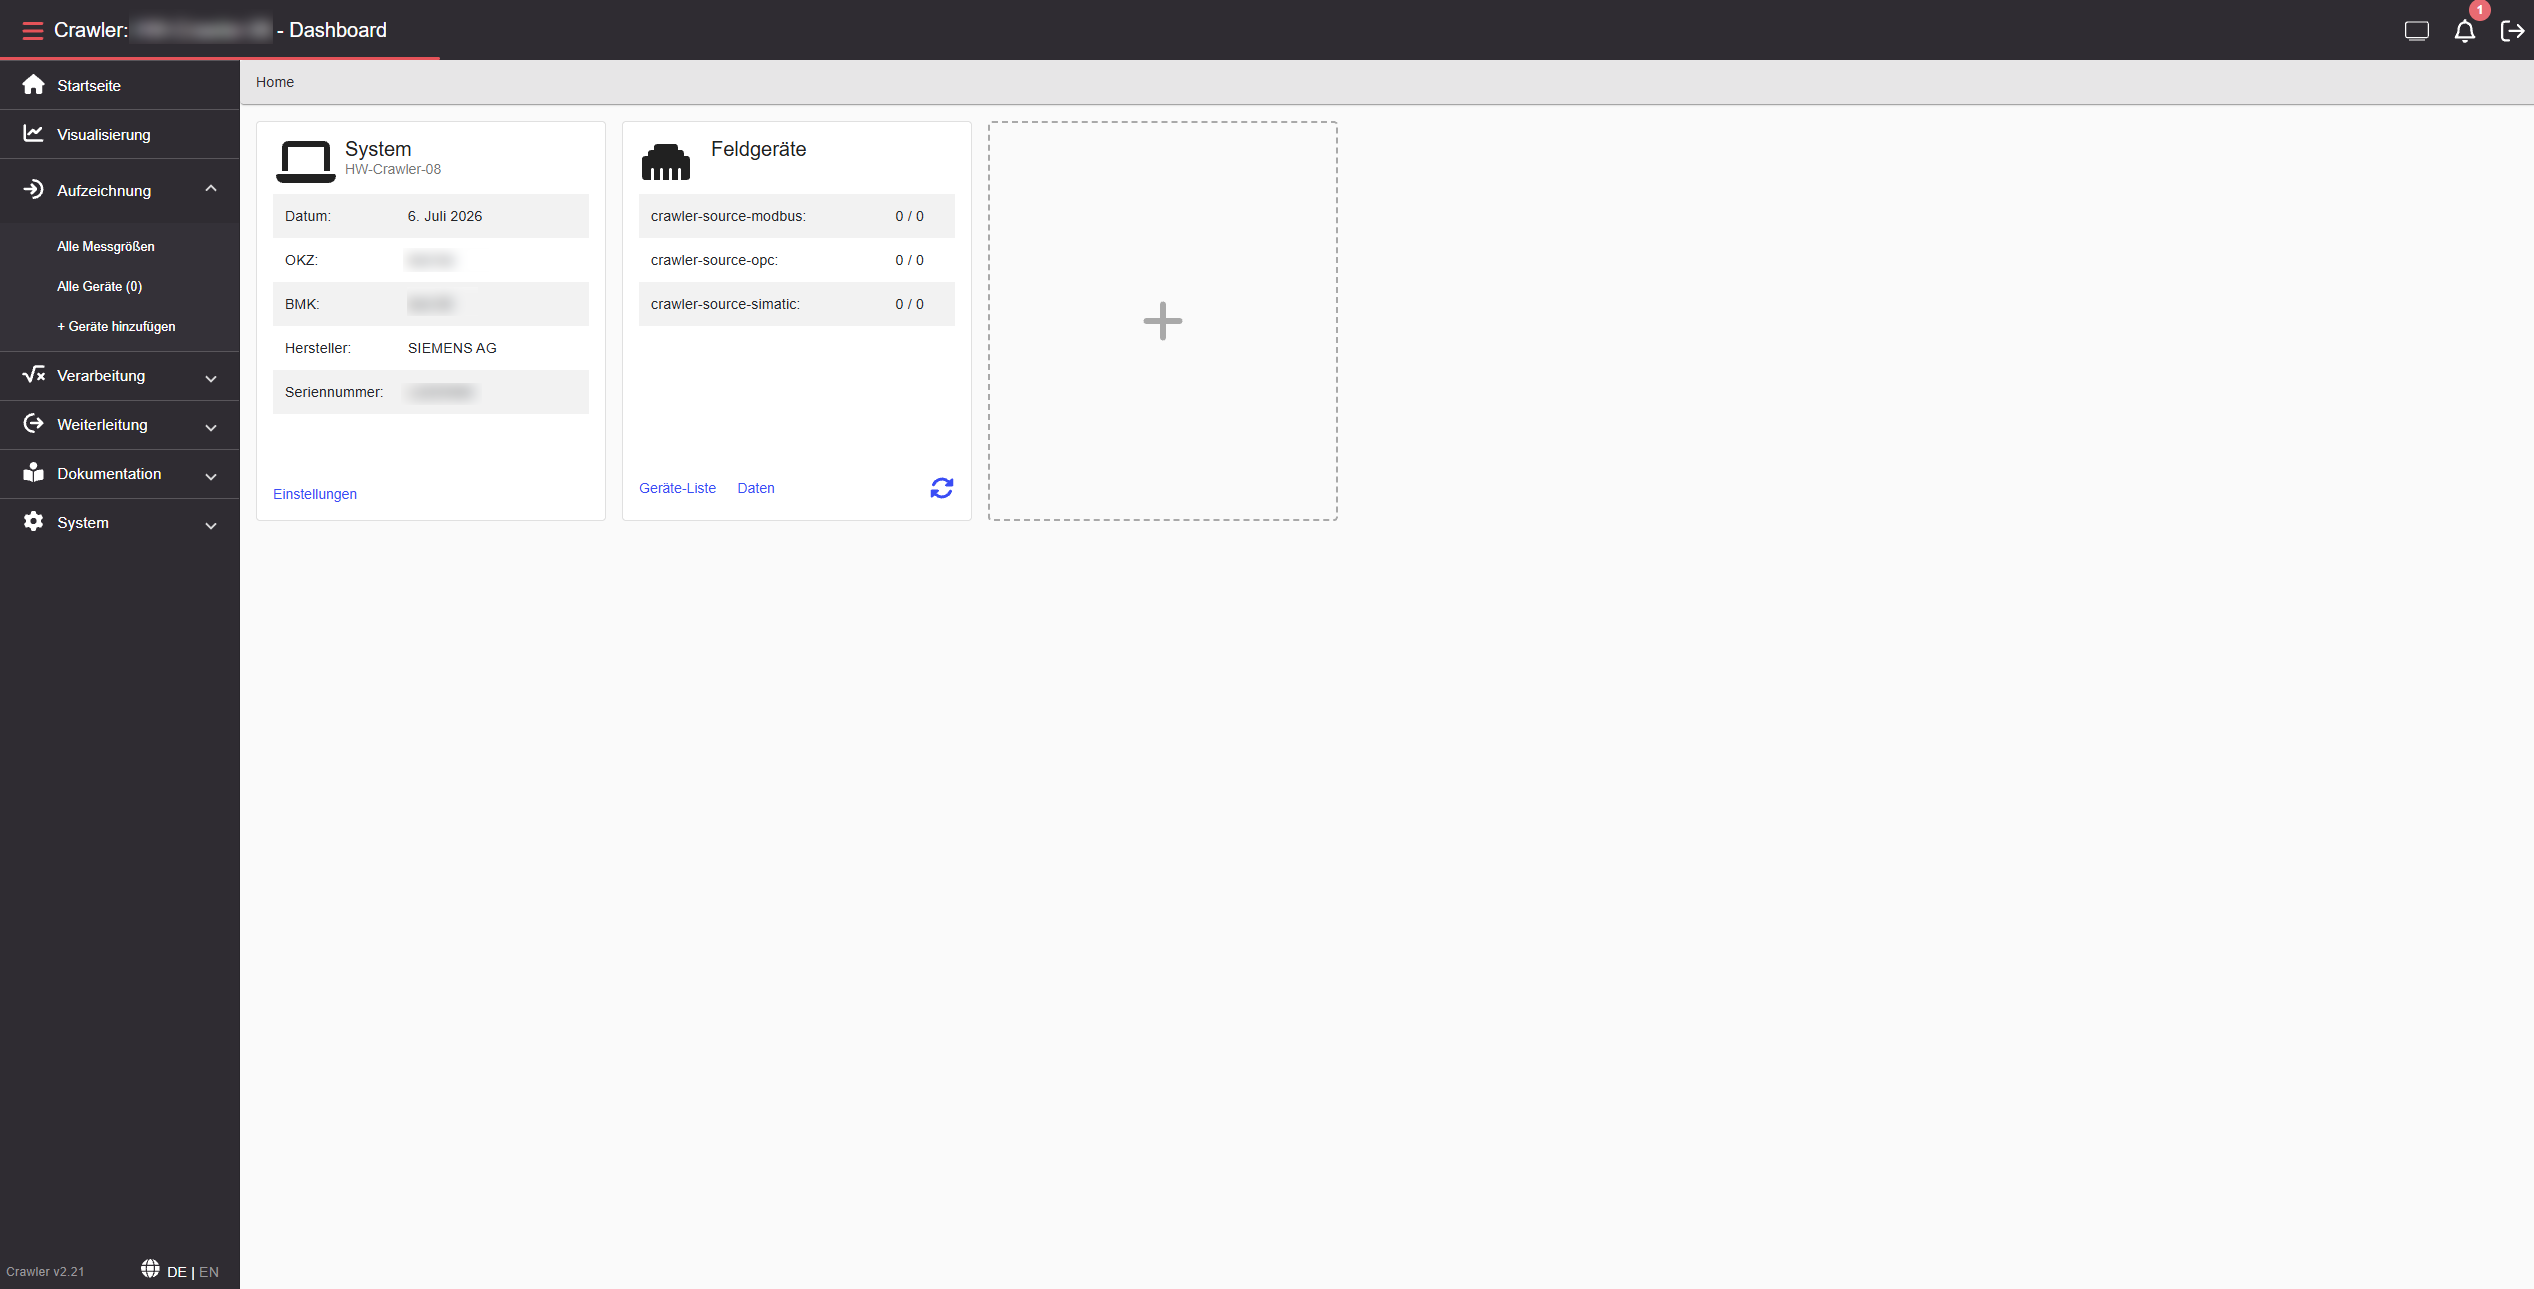
The Home screen gives you an immediate overview of the device and its connected field devices:
| Element | Description |
|---|---|
| System | Device name, manufacturer, and serial number. Click Settings to open device settings. |
| Field Devices | Lists configured data sources (Modbus, OPC, SIMATIC) with the number of connected devices per source. |
| + tile | Add further widgets to your Home view. |
Clicking Visualization in the sidebar redirects you directly to Grafana — a browser-based visualization platform that runs on the Edge device.
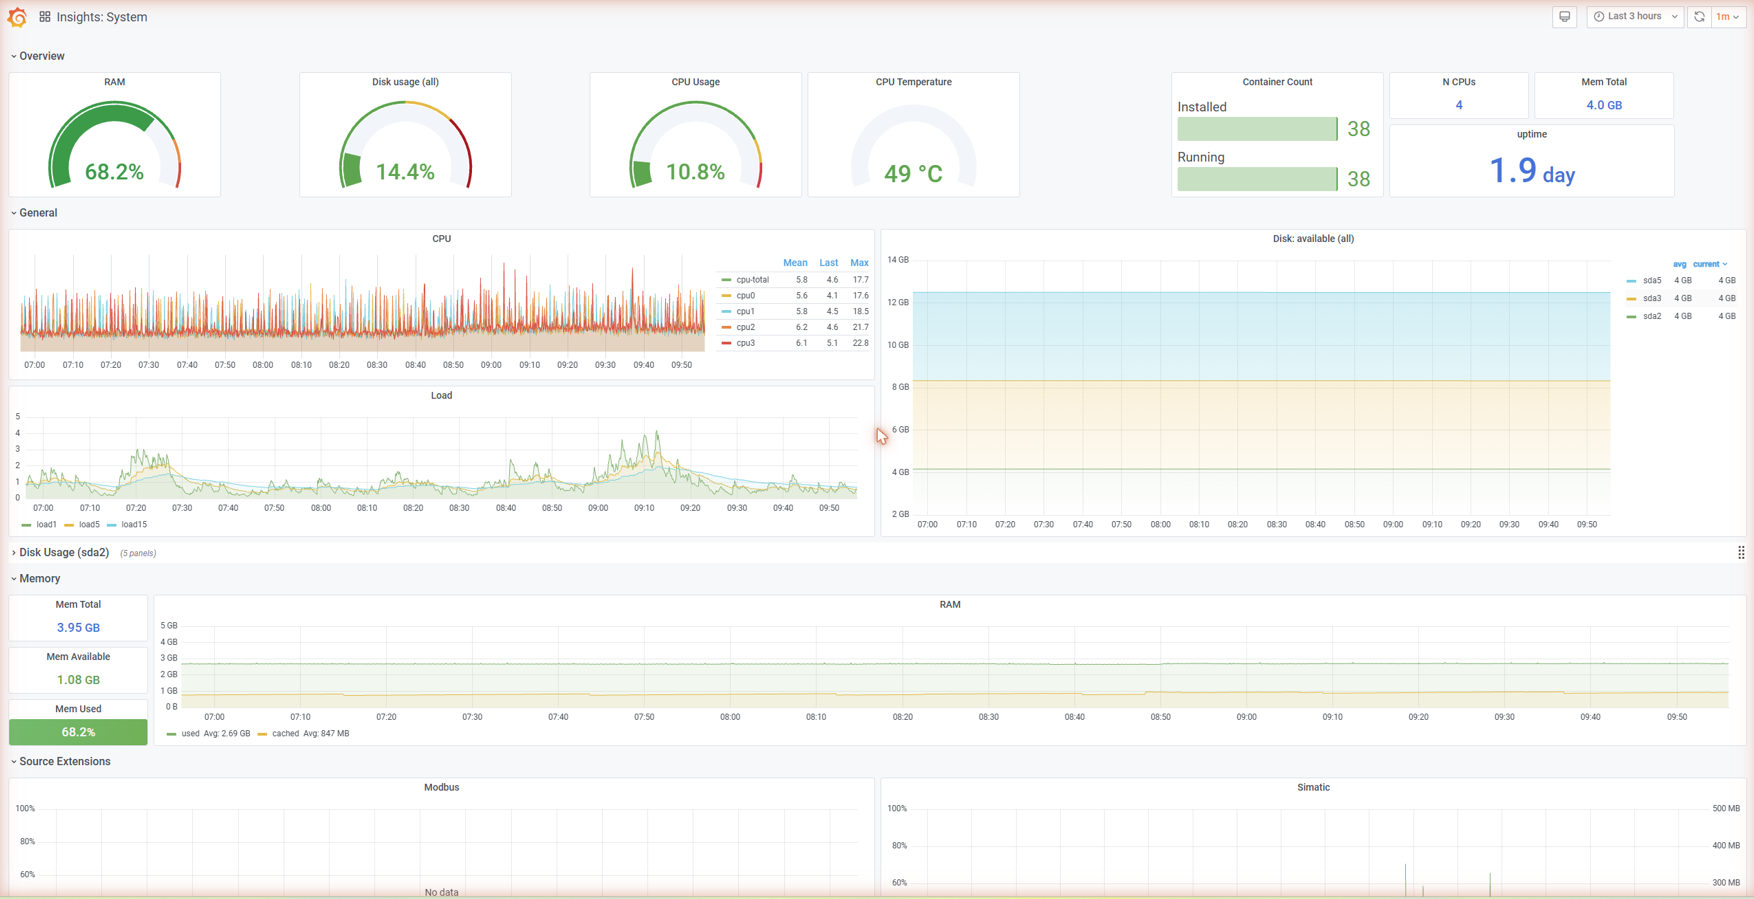
Grafana is pre-installed on the Edge and connects directly to the recorded measurement data. From the home screen you can open existing dashboards or create new ones to visualize your signal data as charts, gauges, and tables.
Navigate to Data Logging in the sidebar to manage your measurement setup. Here you can add and configure field devices as data sources and define which measurement variables to record.
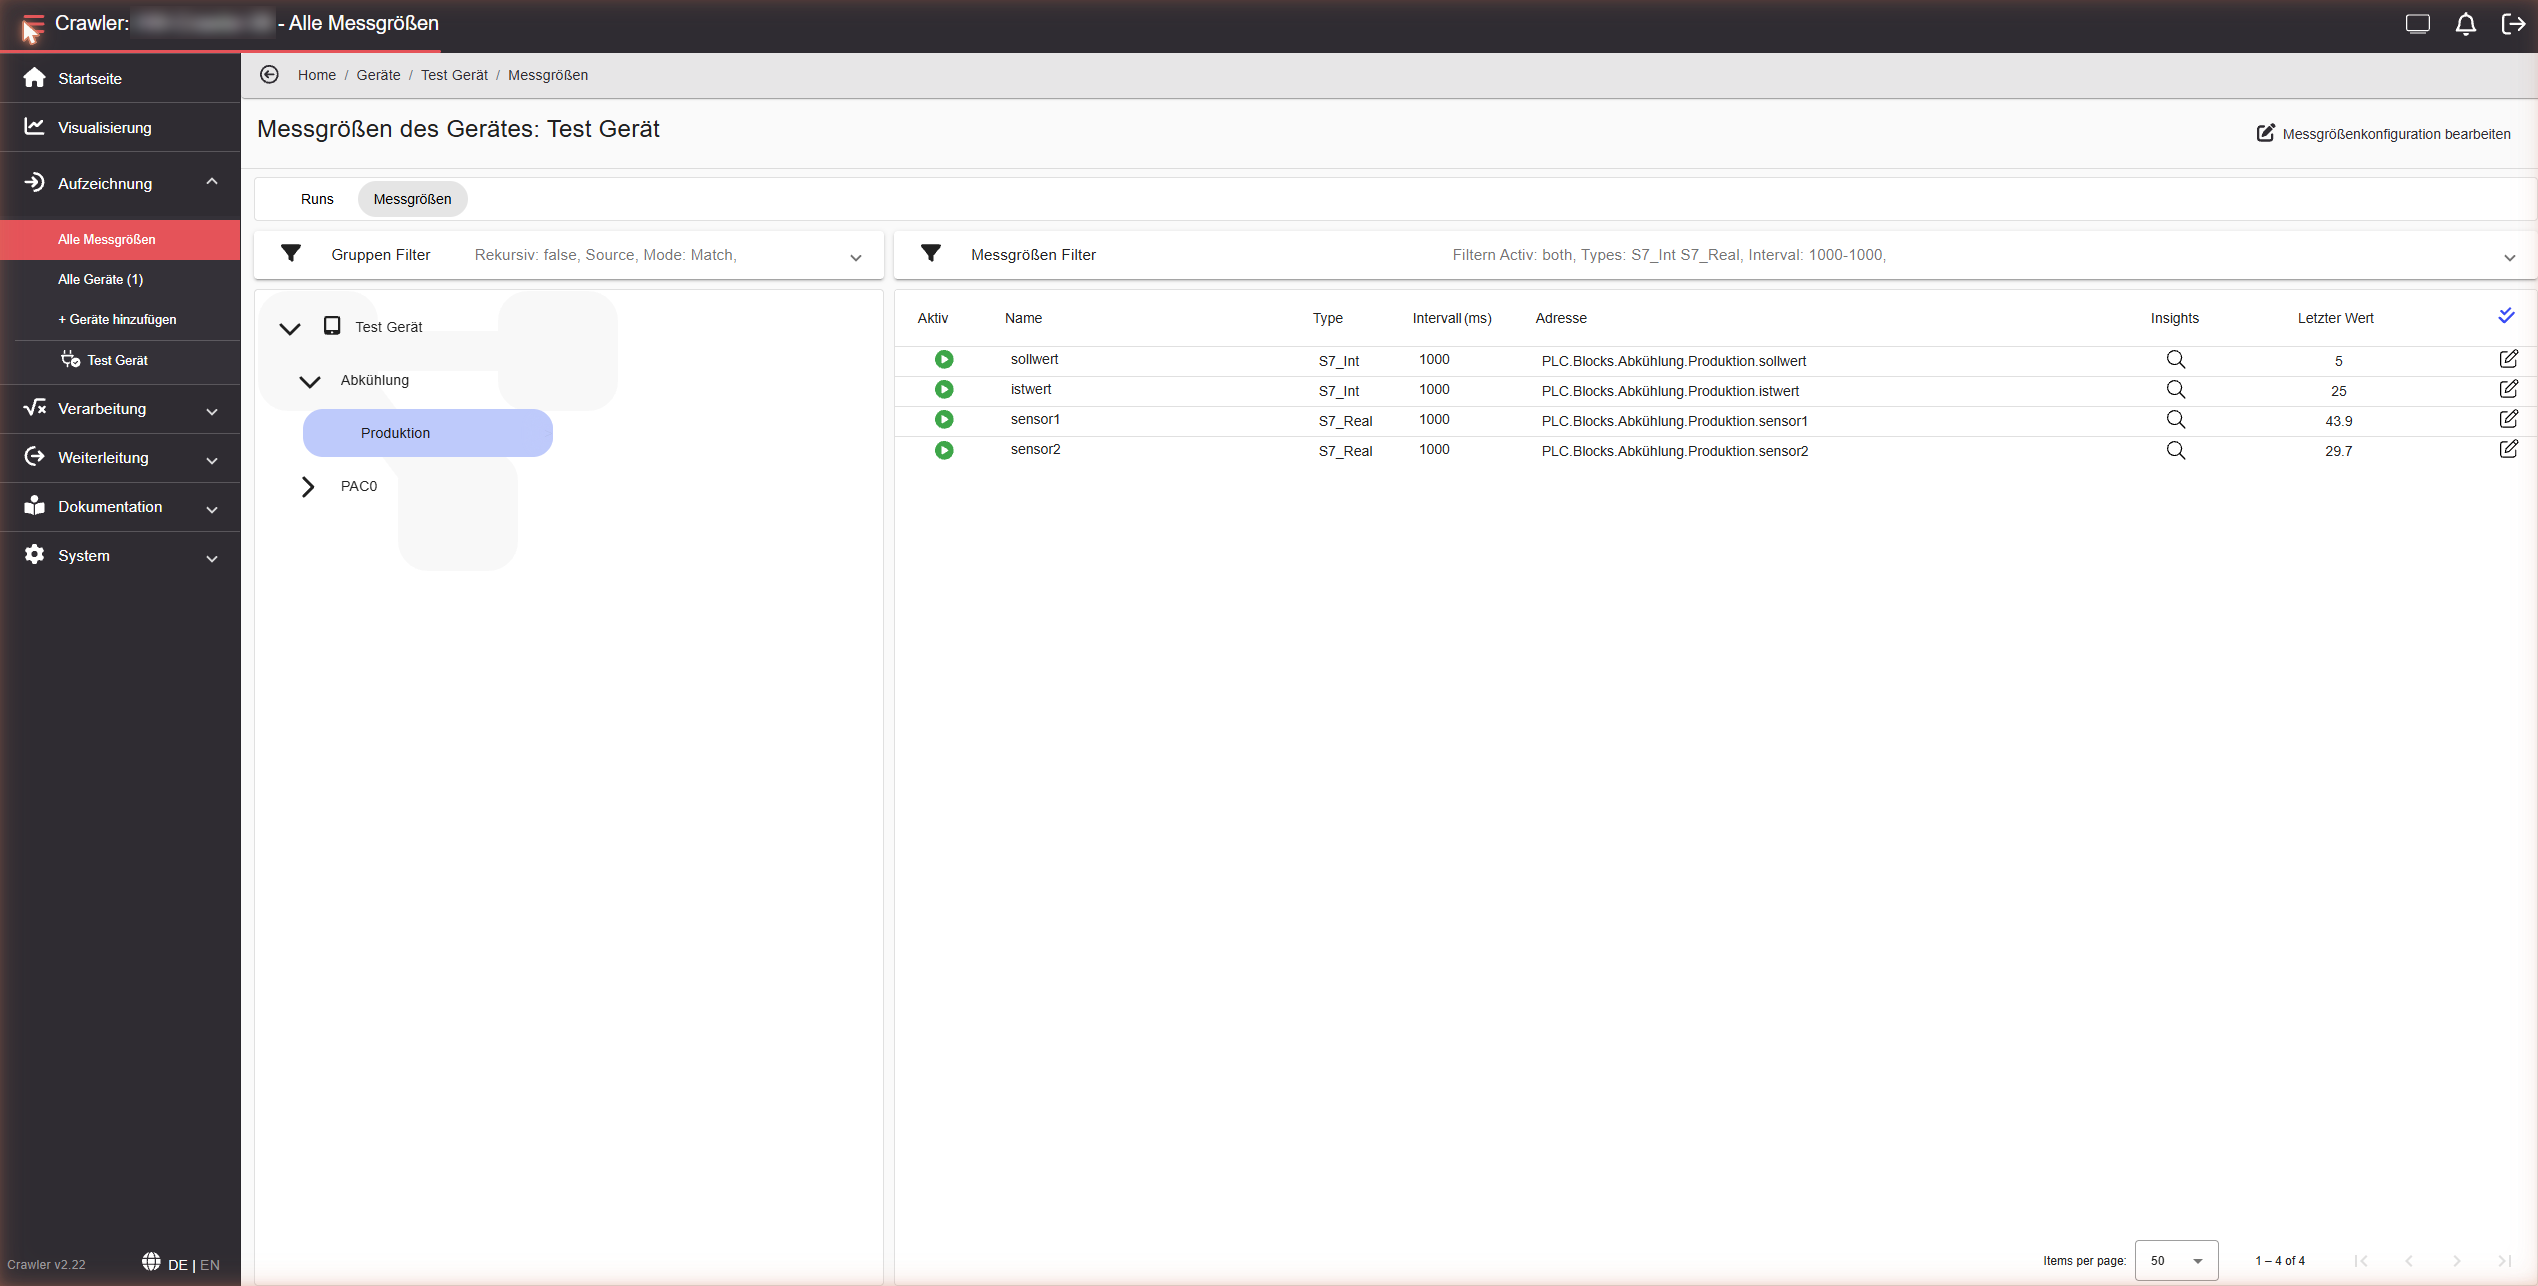
| Section | Description |
|---|---|
| All Variables | Browse all available measurement variables across connected devices. |
| All Devices | View and manage the field devices registered on this Edge. |
| + Add Device | Add a new field device by selecting the protocol (SIMATIC, Modbus, OPC UA) and entering the connection parameters. |
Clicking Data Processing in the sidebar redirects you directly to Node-RED — a browser-based flow editor that runs on the Edge device.
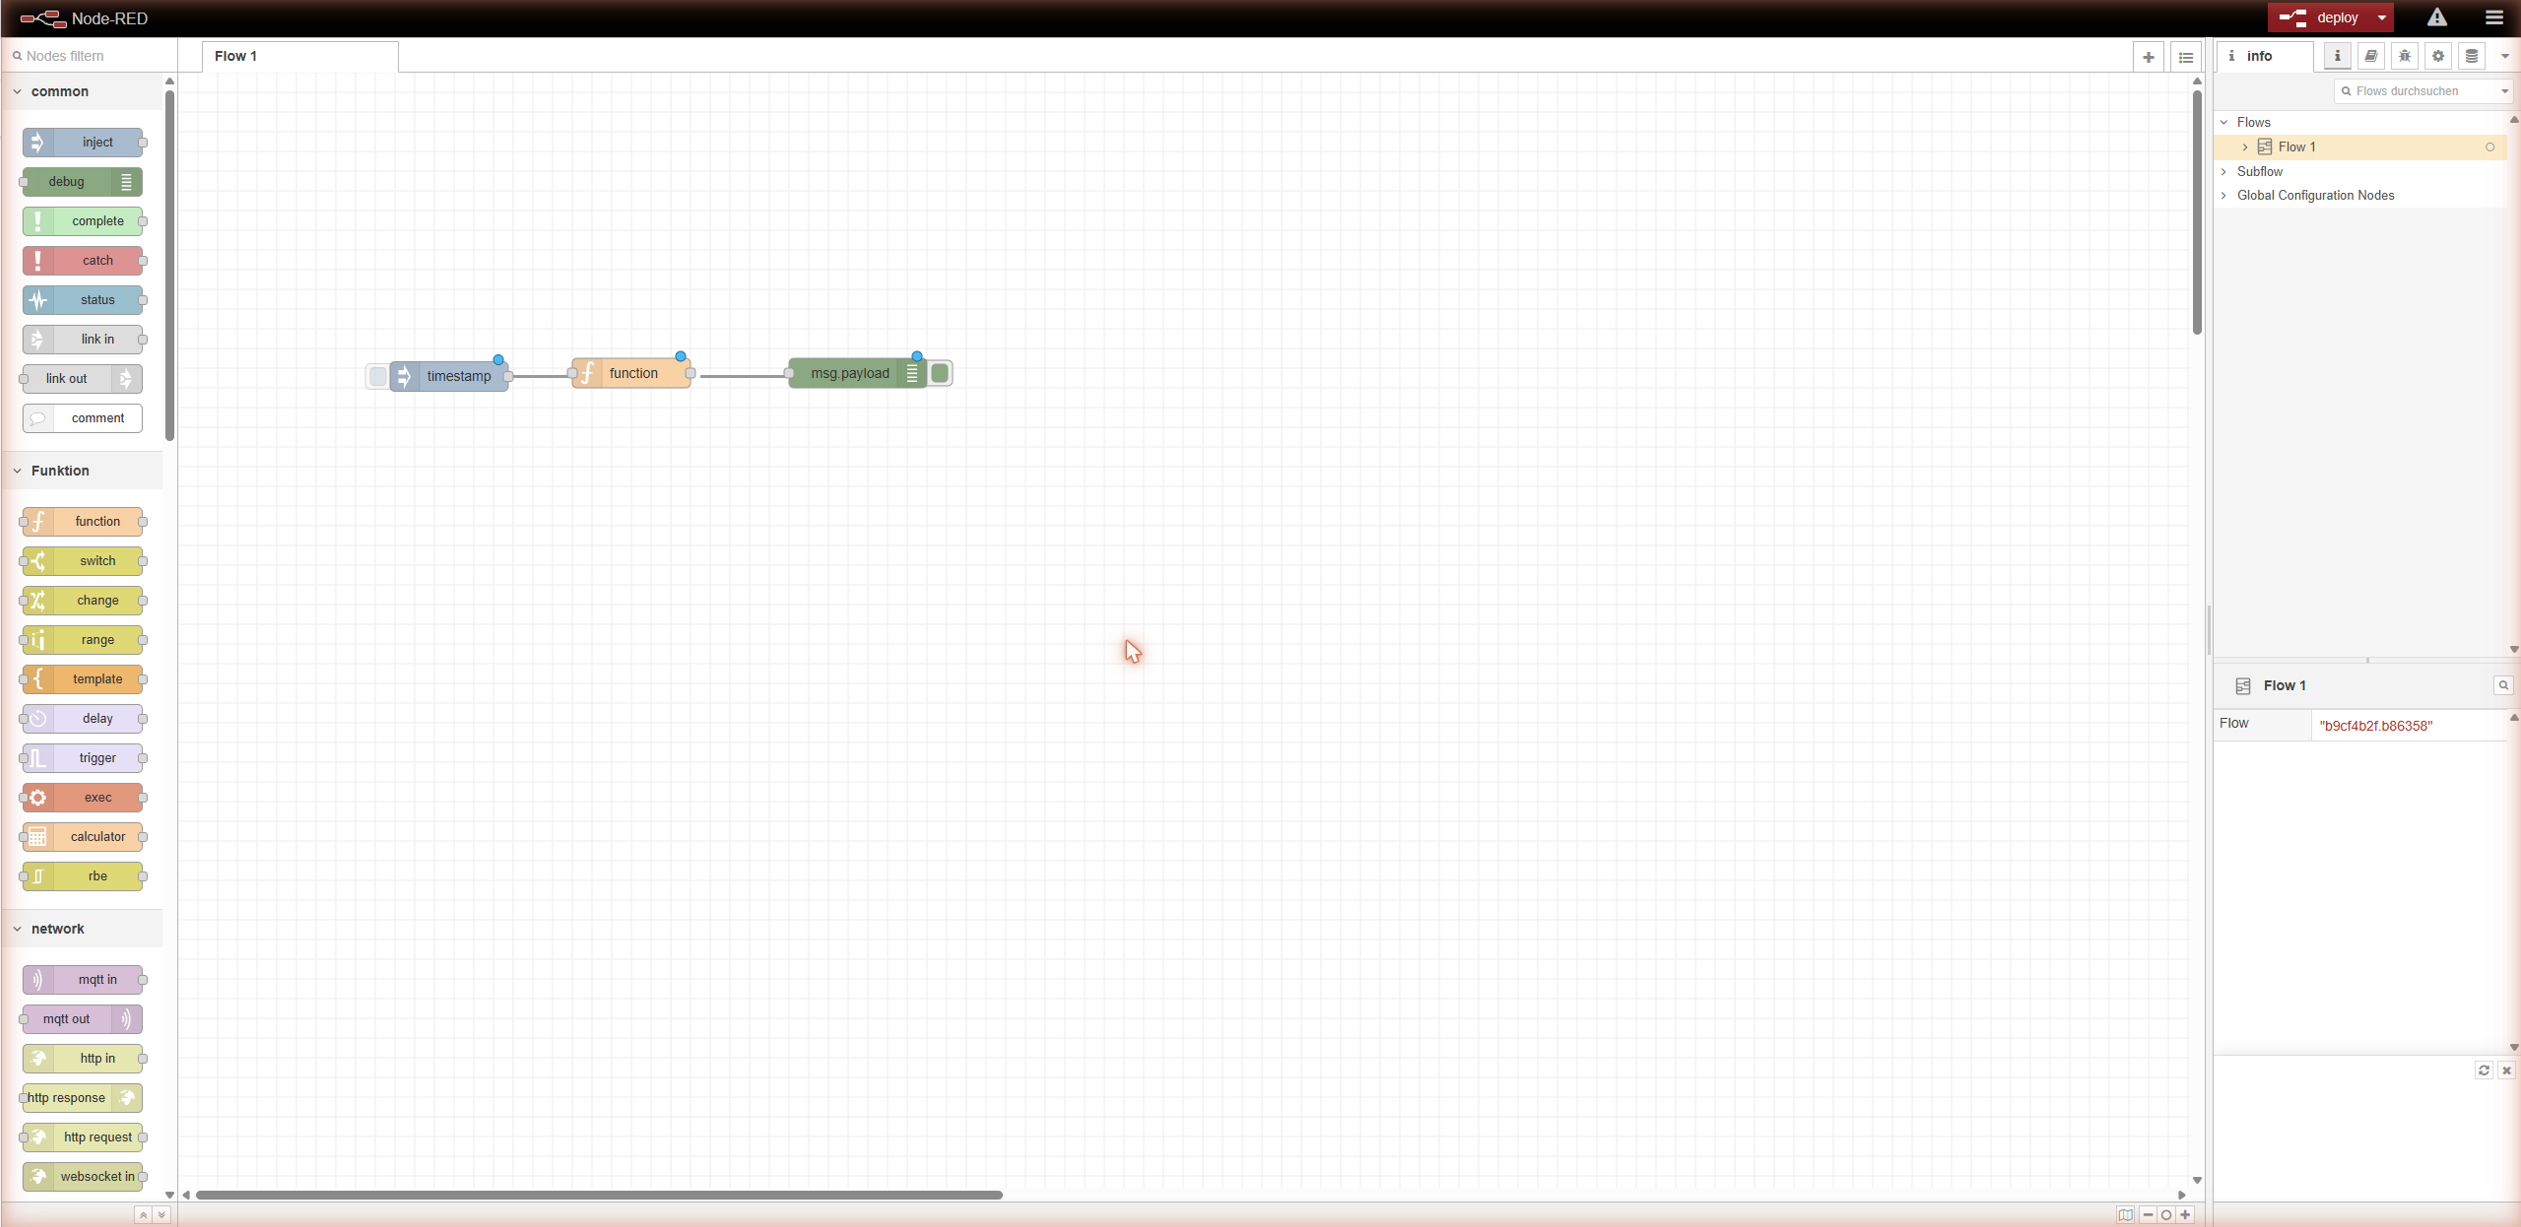
Node-RED lets you create data processing logic visually by connecting nodes into flows. The interface consists of three areas:
| Area | Description |
|---|---|
| Node palette (left) | A library of ready-to-use nodes grouped by category: common, Function (function, switch, change, template…), network (MQTT, HTTP, WebSocket…), and more. |
| Flow canvas (center) | Drag nodes from the palette onto the canvas and connect them to build your processing logic. |
| Info panel (right) | Shows the flow structure (Flows, Subflows, Global Configuration Nodes) and context-sensitive help for selected nodes. |
Navigate to Data Transfer in the sidebar to configure the gateway that forwards recorded data to Invisyne Hub or external systems.
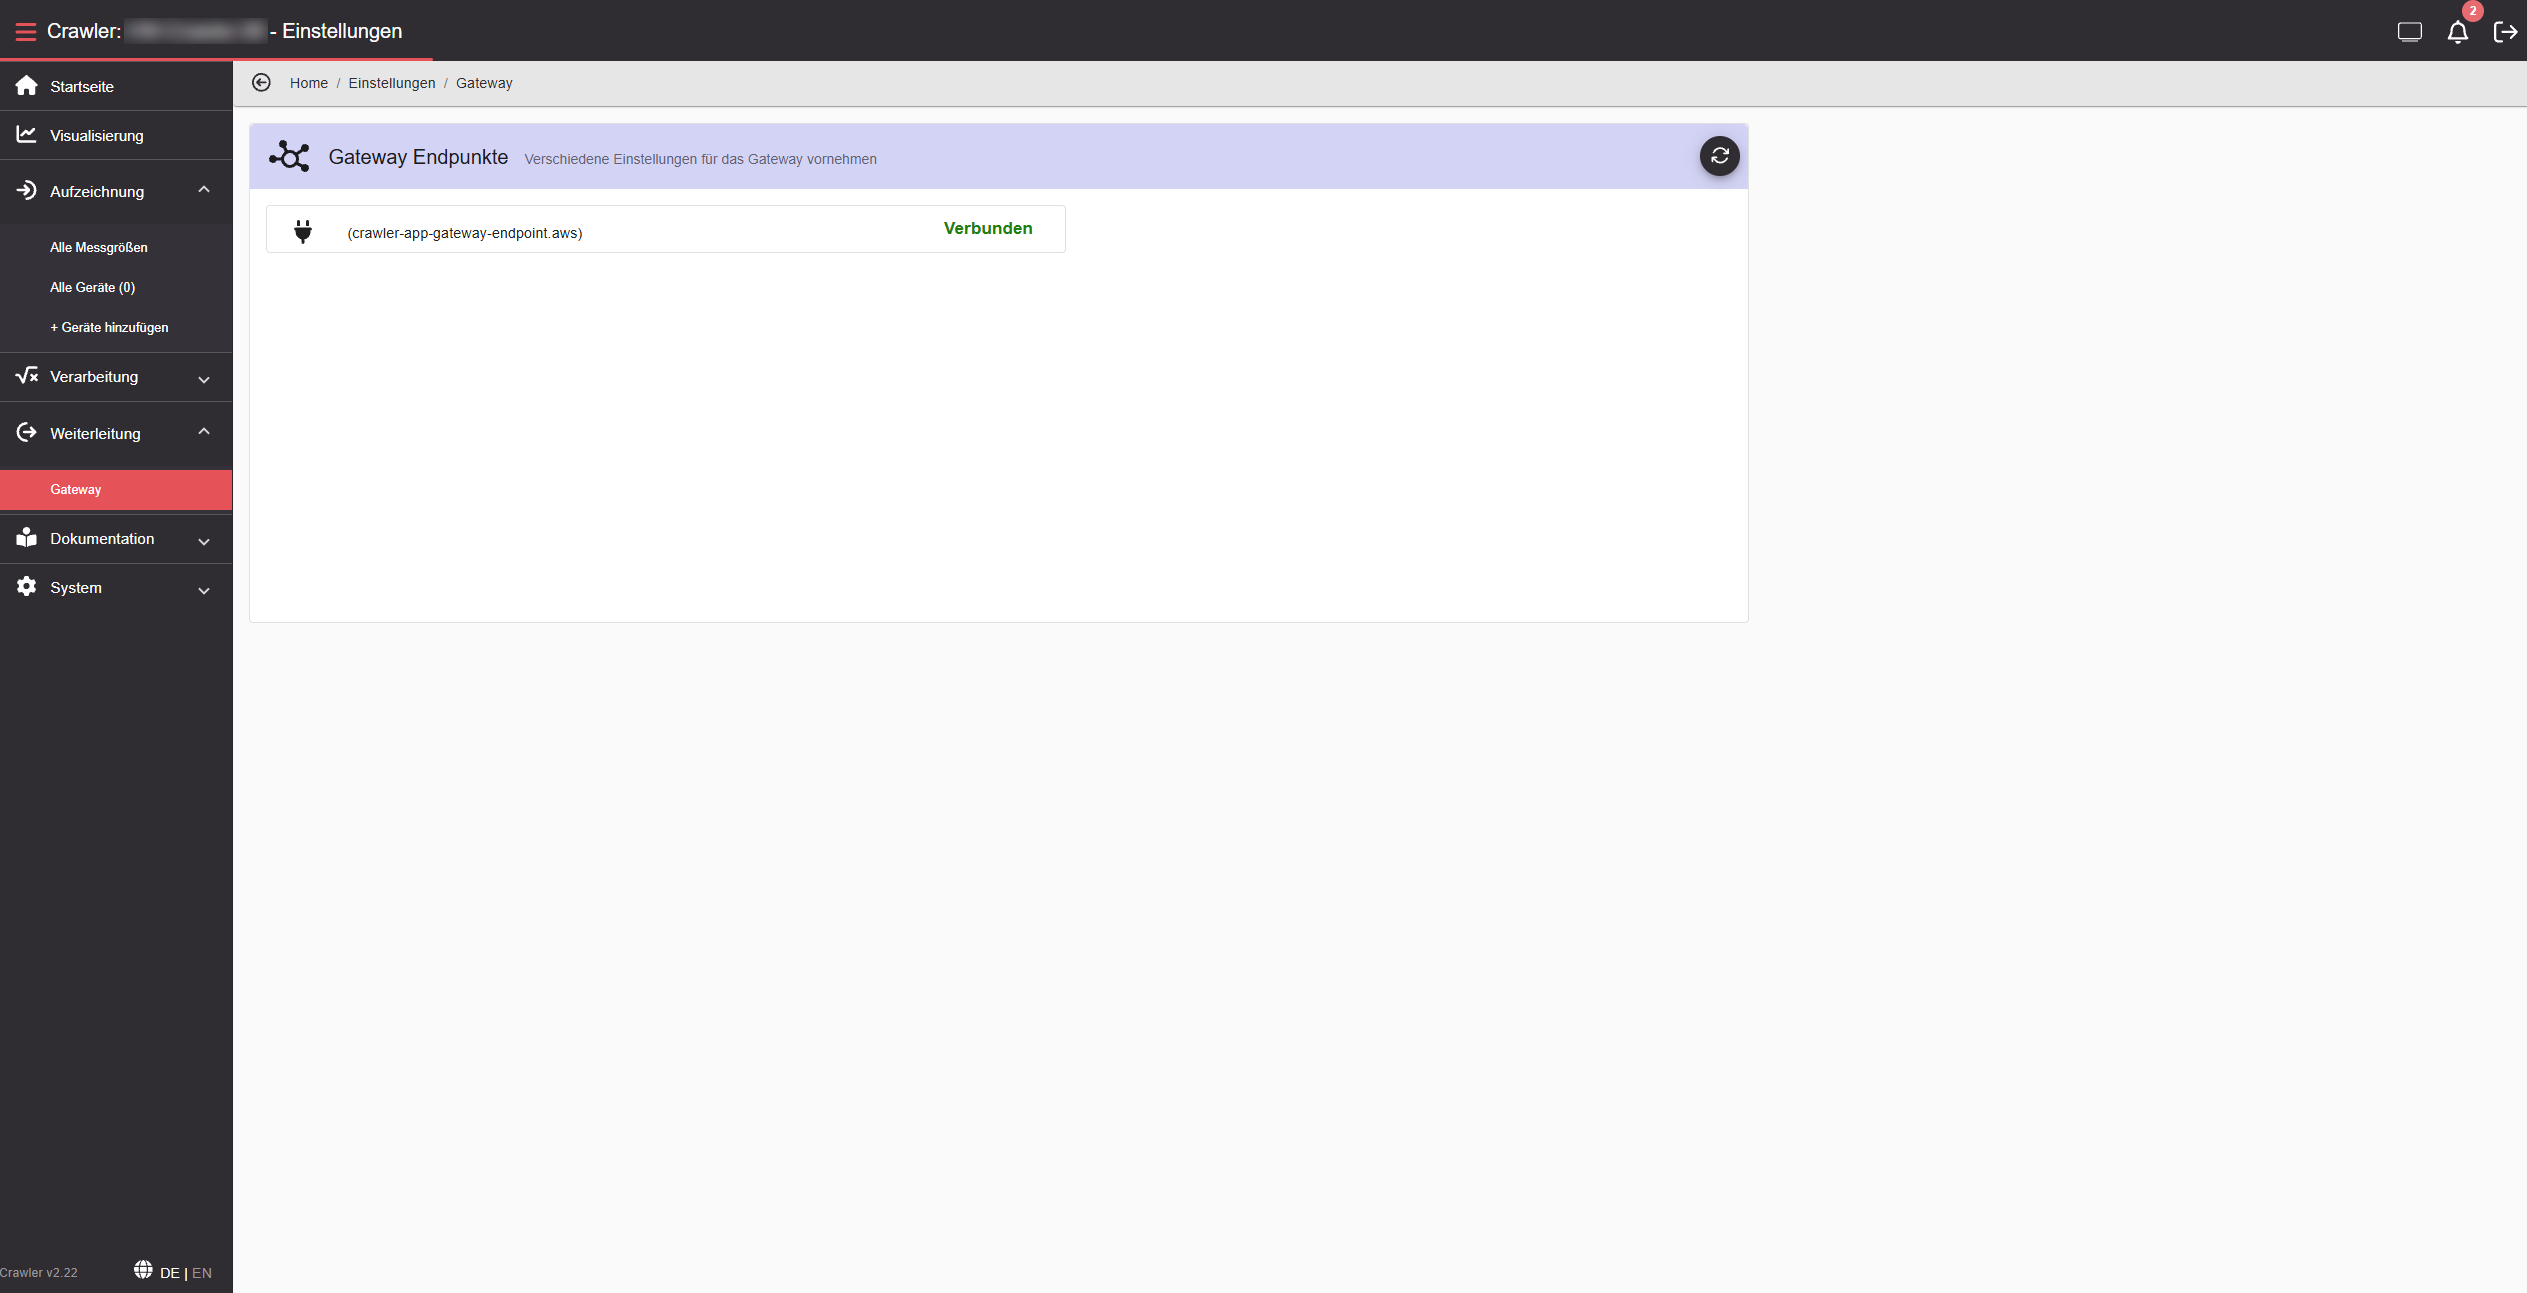
The forwarding target can be configured independently — define which data sources and variables to include, and set the transfer interval or trigger.
Navigate to System → Settings in the sidebar to open the settings menu. It provides access to all device configuration areas in one view.
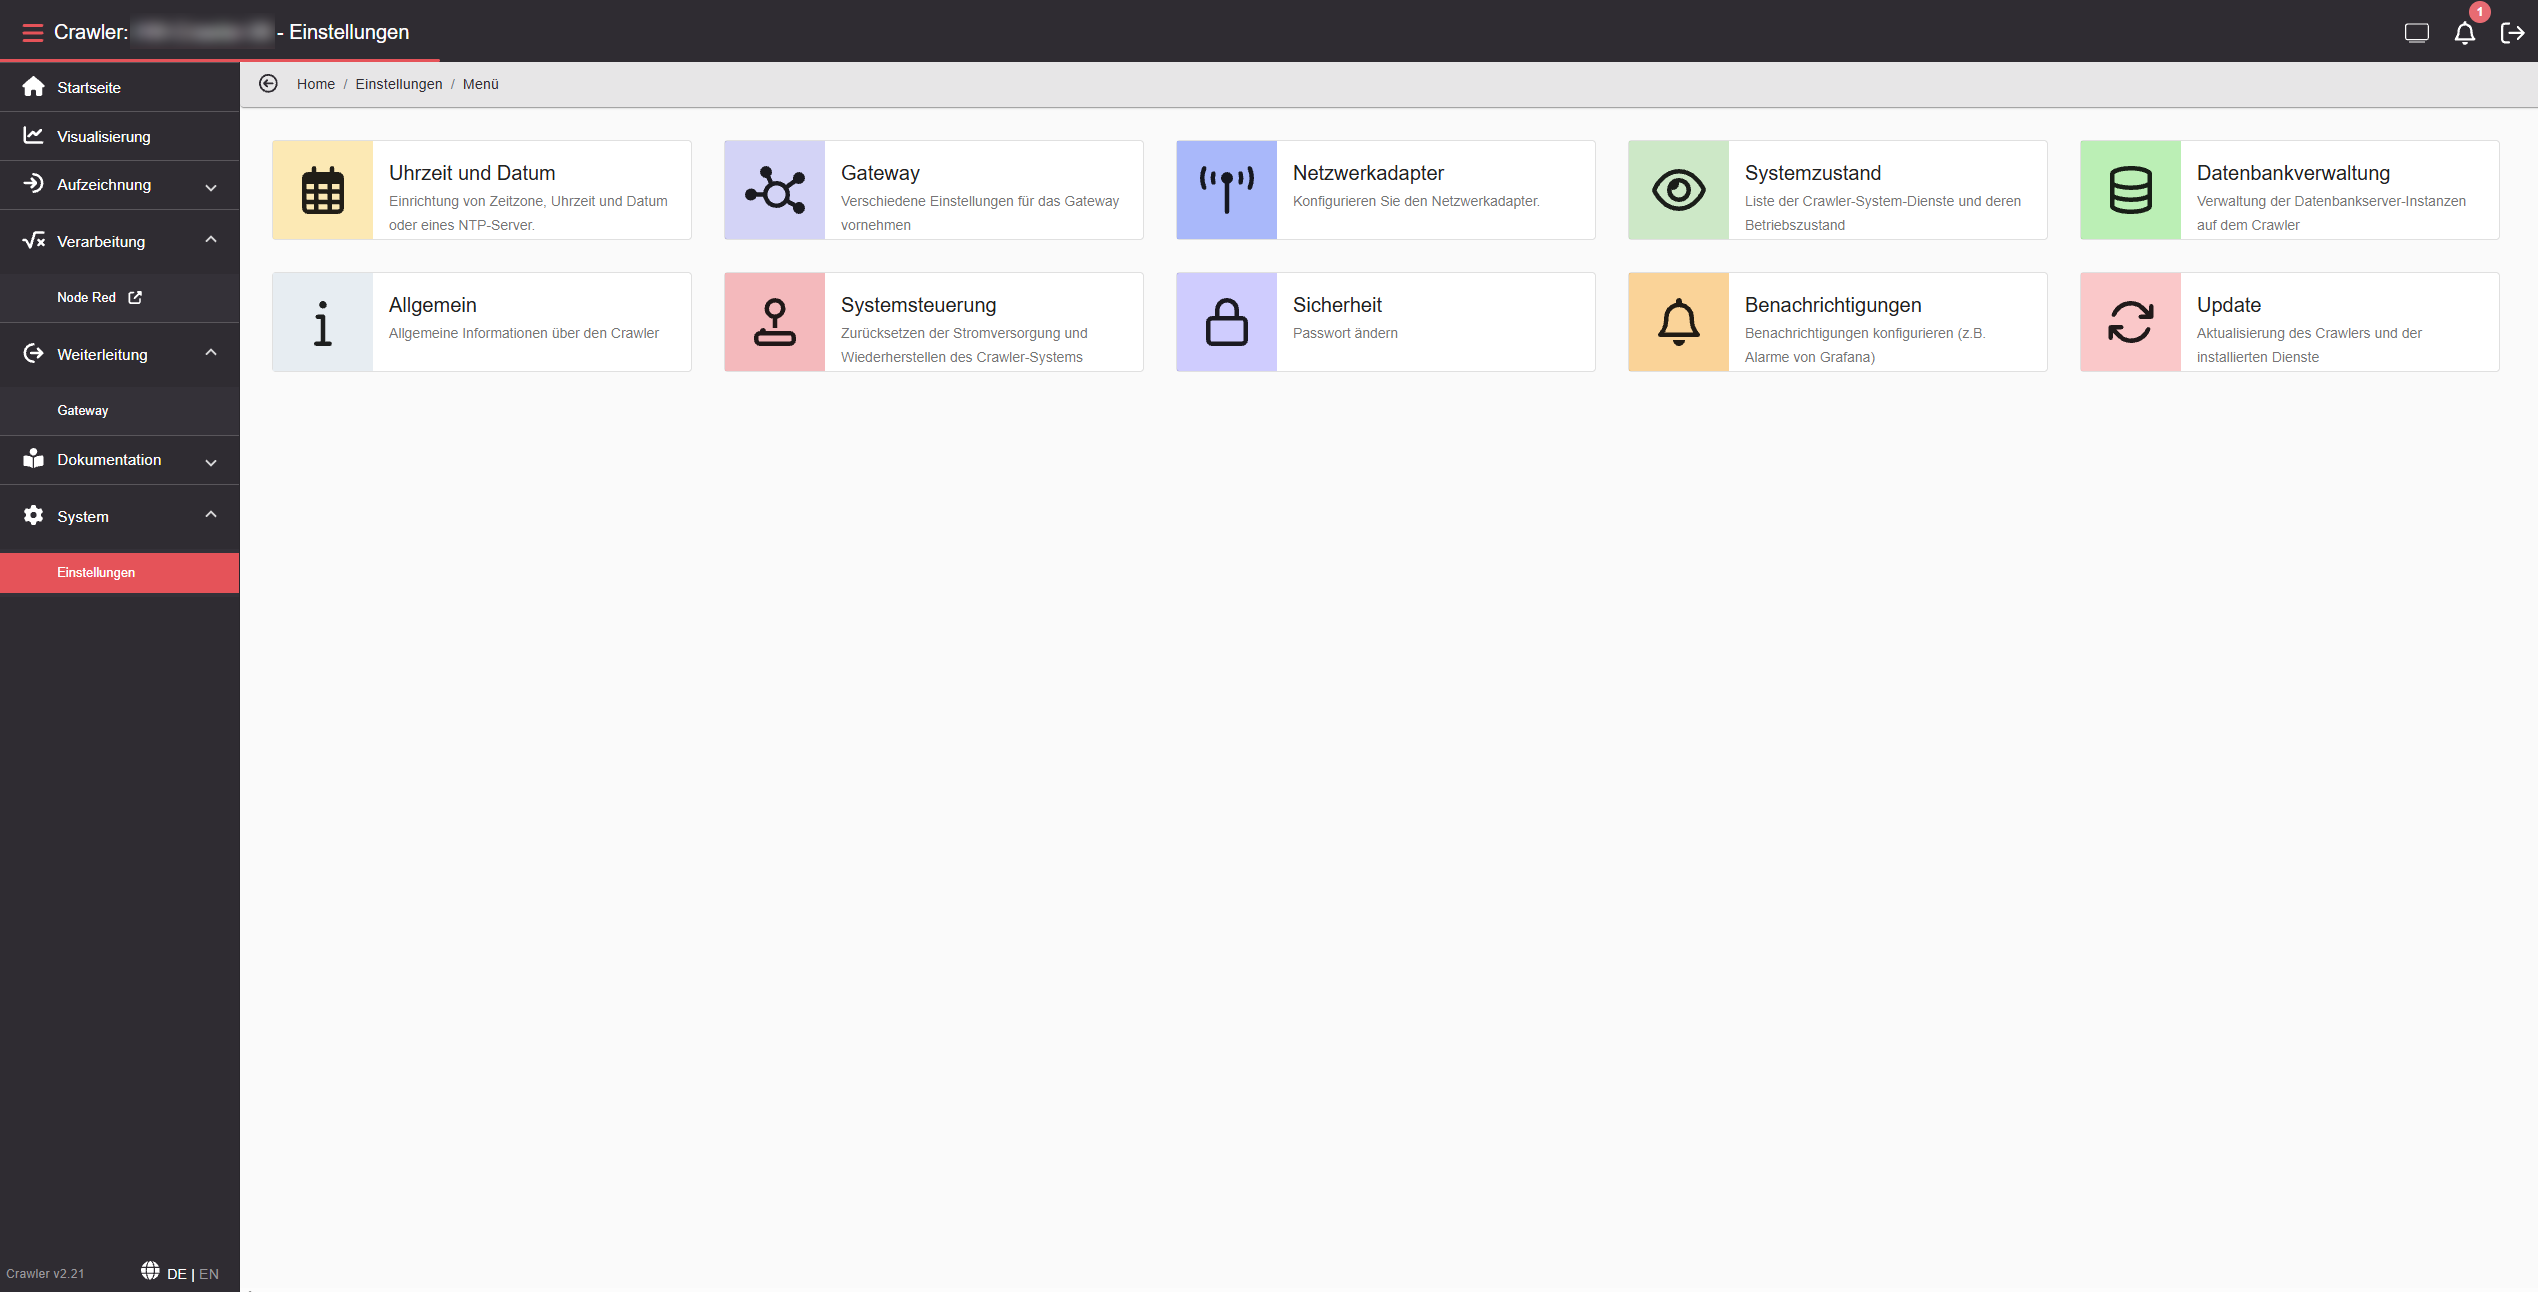
| Setting | Description |
|---|---|
| Time and Date | Set the timezone, time, and date, or configure an NTP server. |
| Gateway | Various settings for the gateway. |
| Network Adapter | Configure the network adapter. |
| System Status | Lists the device’s system services and their operating status. |
| Database Management | Configure the retention period for recorded measurement data. |
| General | General information about the device. |
| System Control | Restart the system or reset the device to factory settings. |
| Security | Change the password. |
| Notifications | Configure SMTP settings to send Grafana alarms by email. |
| Update | Update the Edge software and its installed services. |